In the @nflfastR era (1999-2020), there have been over 64,000 penalties called! Penalties called in high leverage situations can have huge influences on game outcomes and also advanced metrics like expected points added (EPA). One of the reasons that many highly regarded power ranking systems had the 2020 New Orleans Saints very highly rated was due to their “unluckiness” with penalty rates. This article will explore how stable penalties are across teams. Are certain penalty types a reflection of a team’s underlying talent/skill (thus being useful for out of sample prediction), or are they simply random noise that does not predict future performance? If we find that certain penalties are stable for teams across a season, we can probably find a way to incorporate the EPA lost or gained from penalties to develop better predictive measures.
Loading in the data
Let’s start by first reading in play-by-play data from 1999-2020 from @nflfastR.
nfl_pbp <- purrr::map_df(1999:2020, function(x) {
  readr::read_csv(
    glue::glue("https://raw.githubusercontent.com/guga31bb/nflfastR-data/master/data/play_by_play_{x}.csv.gz")
  ) %>%
    dplyr::select(
      game_id, play_id, season, week, home_team, away_team, roof,
      half_seconds_remaining, yardline_100, ydstogo, posteam, defteam,
      desc, play_type, qb_dropback, qb_kneel, qb_spike, rush_attempt, pass_attempt,
      ep, epa, contains("penalty"), yards_gained, down,
      posteam_timeouts_remaining, defteam_timeouts_remaining,
      -c(penalty_player_id, penalty_player_name, first_down_penalty)
    ) %>%
    # change penalty yards to negative yardage if it is on the offense
    dplyr::mutate(penalty_yards = ifelse(penalty_team == posteam, -penalty_yards, penalty_yards))
})
Exploring stability of penalties
Since penalties are relatively rare events, especially when grouping by specific penalty types, we will bucket each team and penalty type into quarter seasons (a 4 game window) and then find the correlation between quarter season penalty percentages across teams during a season.
Note that we group Encroachment, Defensive Offside and Neutral Zone Infraction penalties as all Defensive Offsides penalties, Illegal Contact, Defensive Holding and Defensive Pass Interference penalties as all Defensive Pass Interference and Illegal Shift, Illegal Formation and Illegal Motion as all Illegal Shift penalties, among other groupings.
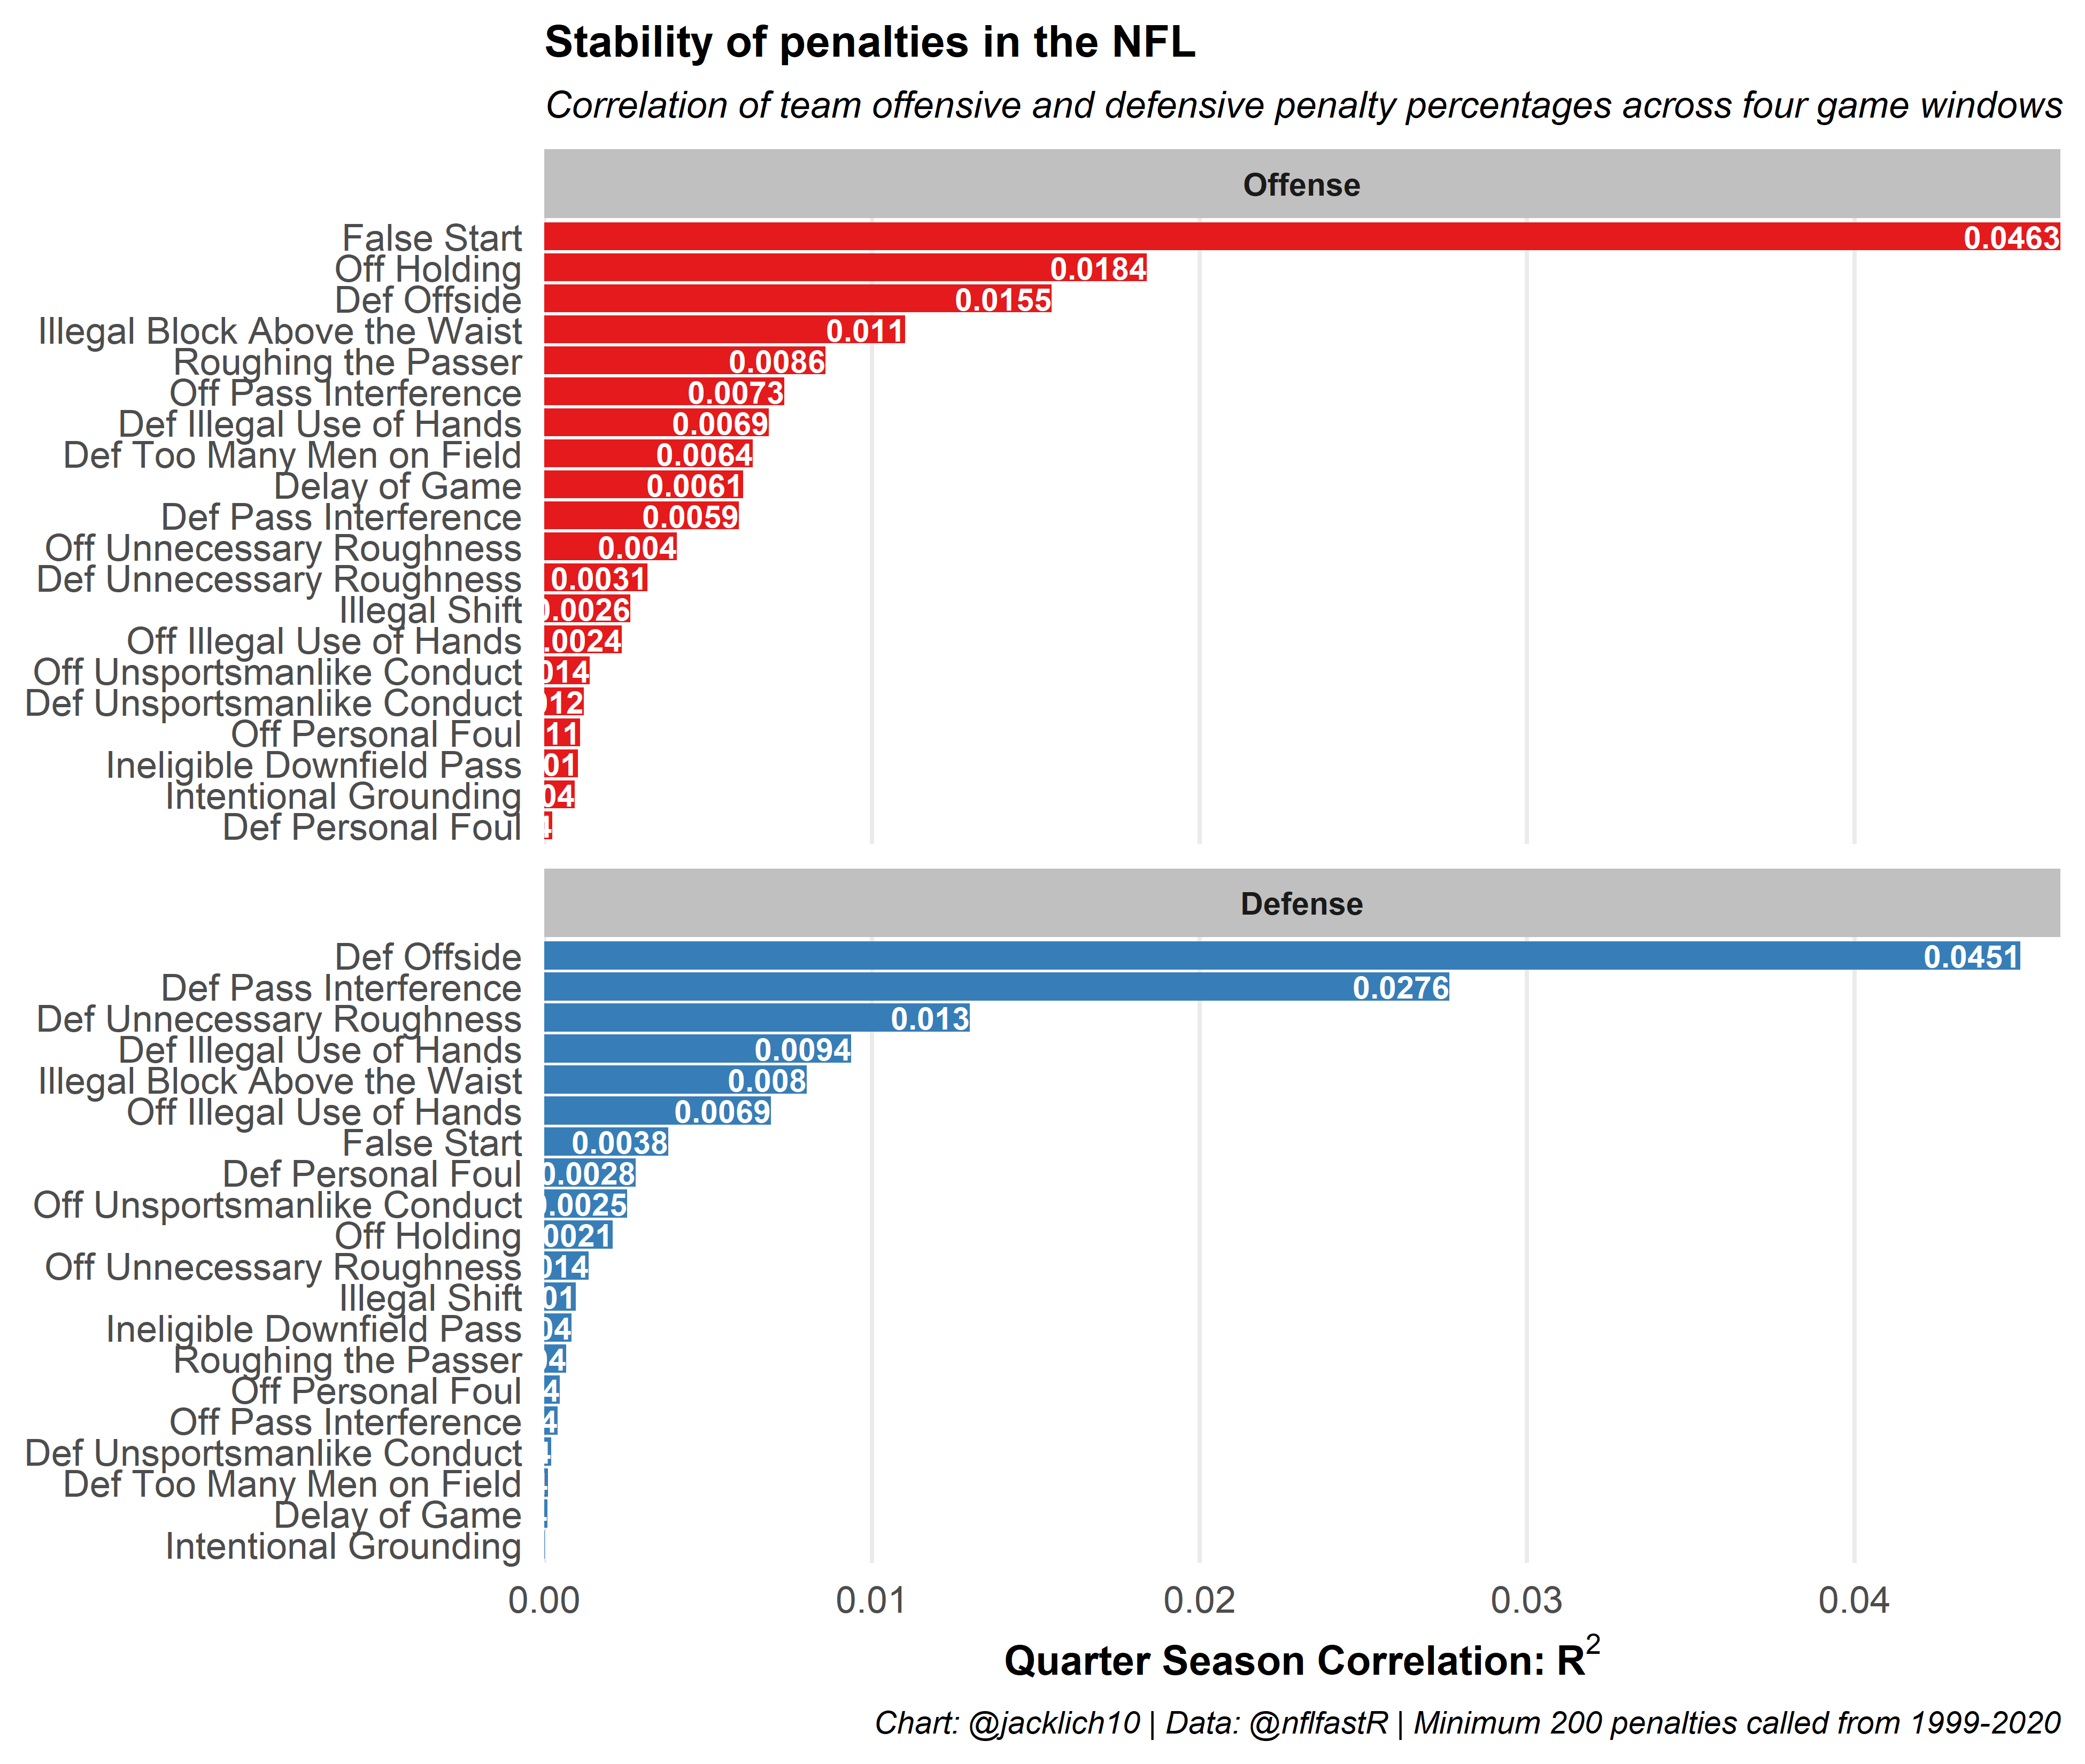
These results are fairly intuitive! Immediately, we see that the less subjective penalties like offensive False Start and Defensive Offside penalties are the most stable penalty types in football. In other words, the number of False Start penalties an offense commits probably reflect some measure of team skill or discipline that might be helpful in predicting future outcomes. We also notice, that for the most part, offenses control penalties more than defenses. For example, while obviously penalizing a defense, Defensive Too Many Men on Field penalties are controlled more by the offense than the defense! After all, defenses are inherently reactionary to their offensive counterparts.
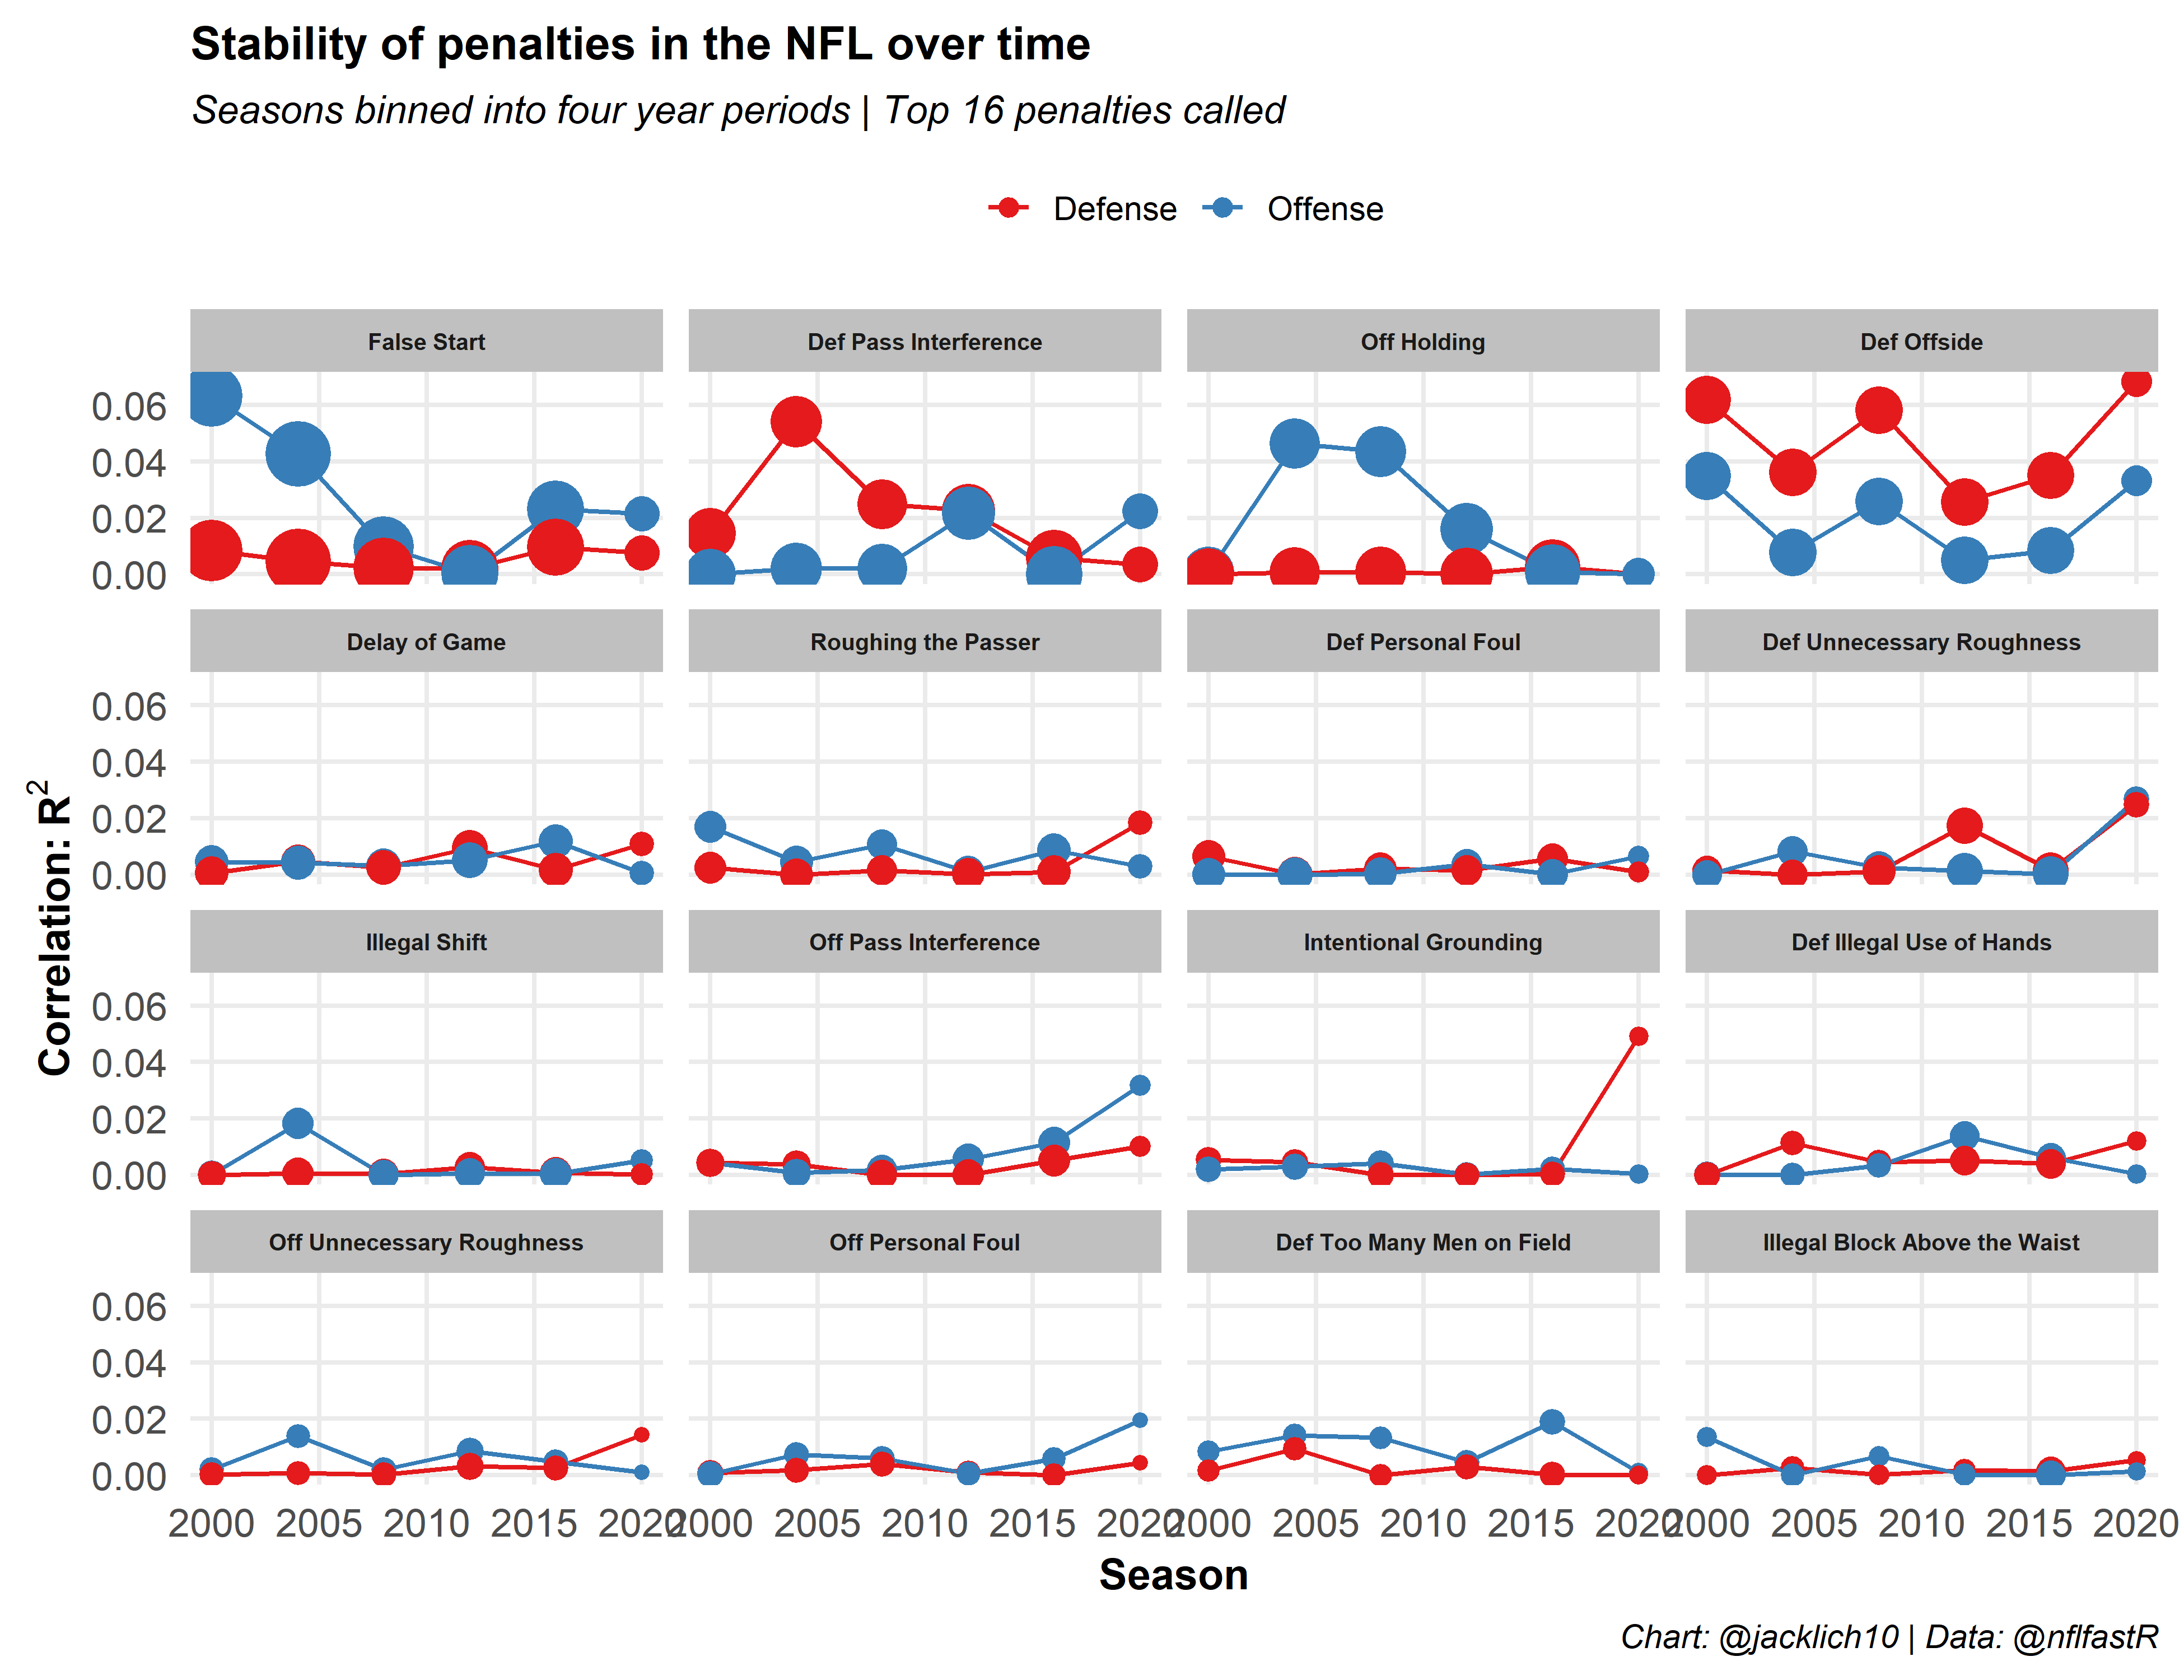
Generally, however, penalties are extremely fluky and unstable metrics for teams, especially for defenses (other than Defensive Offsides), and especially when we take into account how penalty rates have changed over time. As such, how can we take this information into account for prediction. Should we be rewarding defenses with negative EPA (negative is good for defense) when the offense commits a False Start or Delay of Game, for example? Probably not. If we are going to predict future game outcomes, it might be smart to evaluate a team in a sort of “penalty-free” environment (save for the few penalties that might carry some signal for future performance).
Penalty EPA methodology
In the @nflfastR database, it is important to note that the expected points added value does not account for a nullified play by penalty. In other words, a long rush that is called back on an Offensive Holding penalty will be negative EPA, and in some sense, we lose the EPA of the long rush had it not been called back.
Thus, for each play with a penalty, we will calculate the EPA of the nullified play using the nflfastR::calculate_expected_points() function. Then, we can compare this value to the actual observed EPA value from the penalty. This new value, called penalty_epa, is the difference between the EPA a team would have gained/lost if there was no penalty and the actual observed EPA from the penalty. Finally, we calculate no_penalty_epa, which is the difference between the original EPA and penalty EPA, representing the EPA gained/lost in a “penalty-free” world.
Note that we are not going to look at any special teams penalties. The code for calculating penalty_epa and no_penalty_epa can be found in the source code. If these values are something that interests the community, maybe they can be added to the @nflfastR play by play dataset over the off-season.
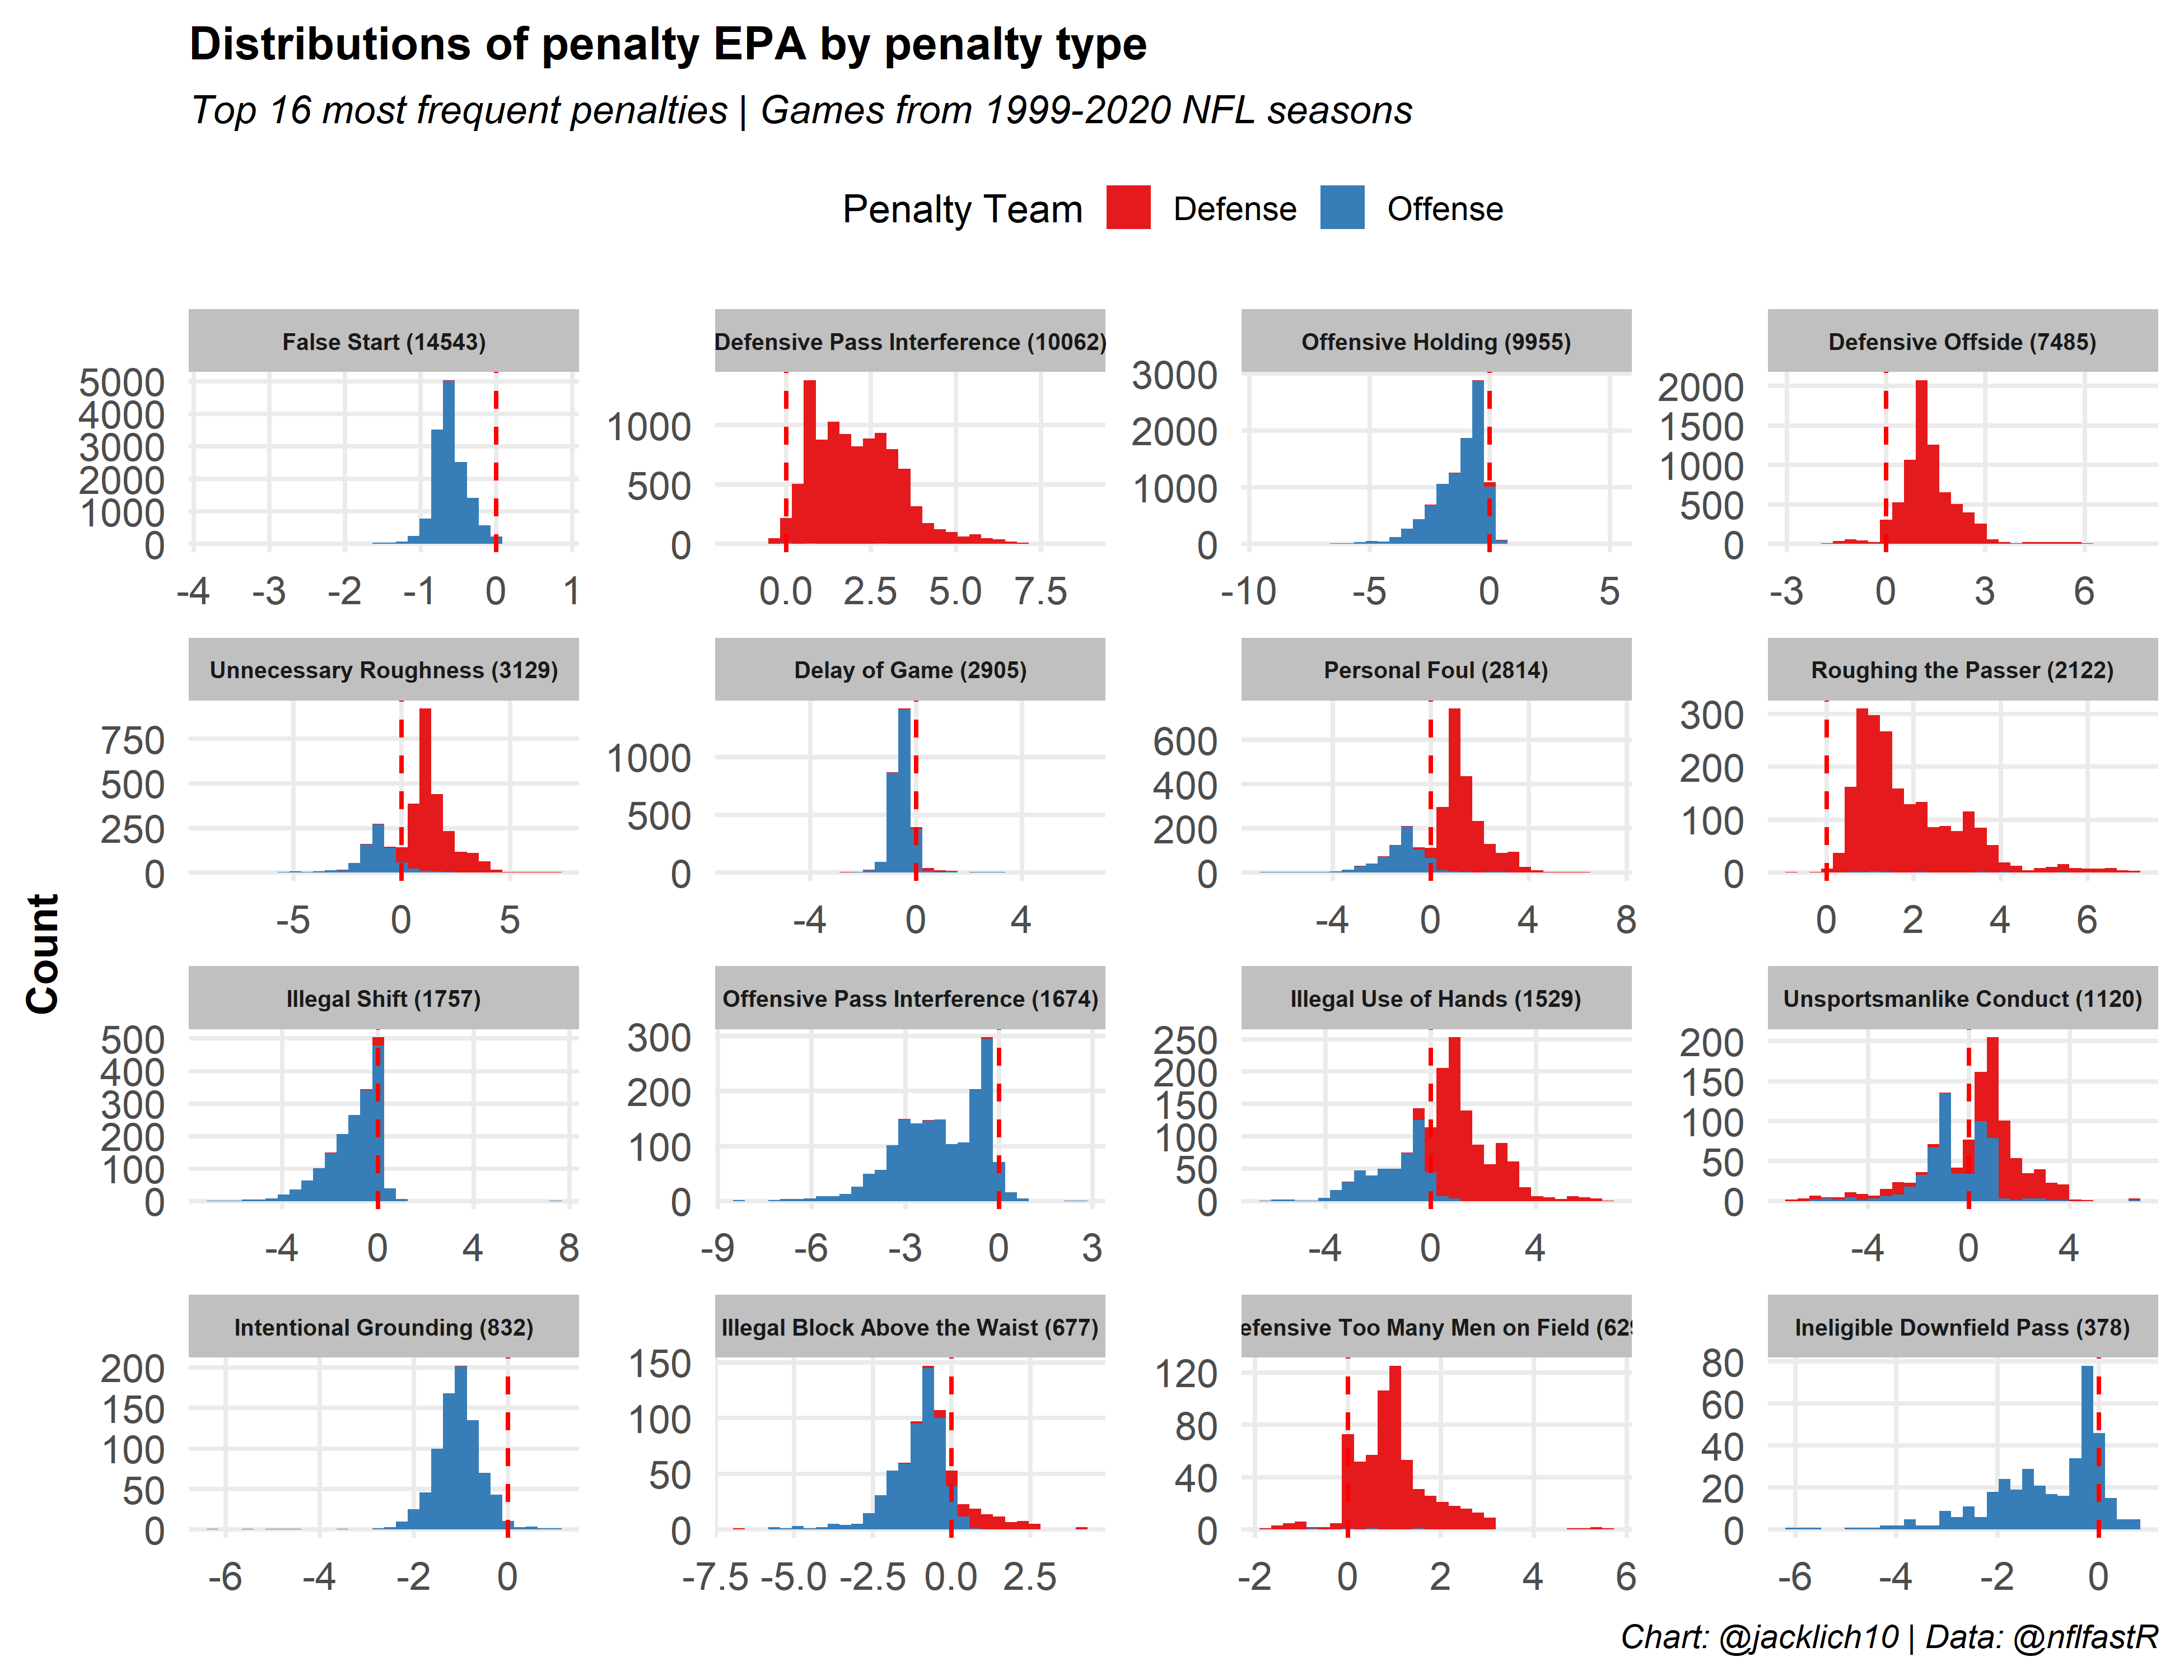
First, let’s examine the distributions of penalty EPA by penalty type as a sanity check. These distributions look pretty good and match our expectations. For example, Defensive Pass Interference penalties are positive EPA while Offensive Holding penalties are negative EPA. Notice that there are a couple observations in many penalty types where penalty EPA does not match our expectations. I have tried to fix these edge cases the best I can, but also note that an Illegal Shift penalty that negates a 3rd down failed conversion would actually yield positive EPA for an offense since the down is replayed, giving the offense another chance at conversion.
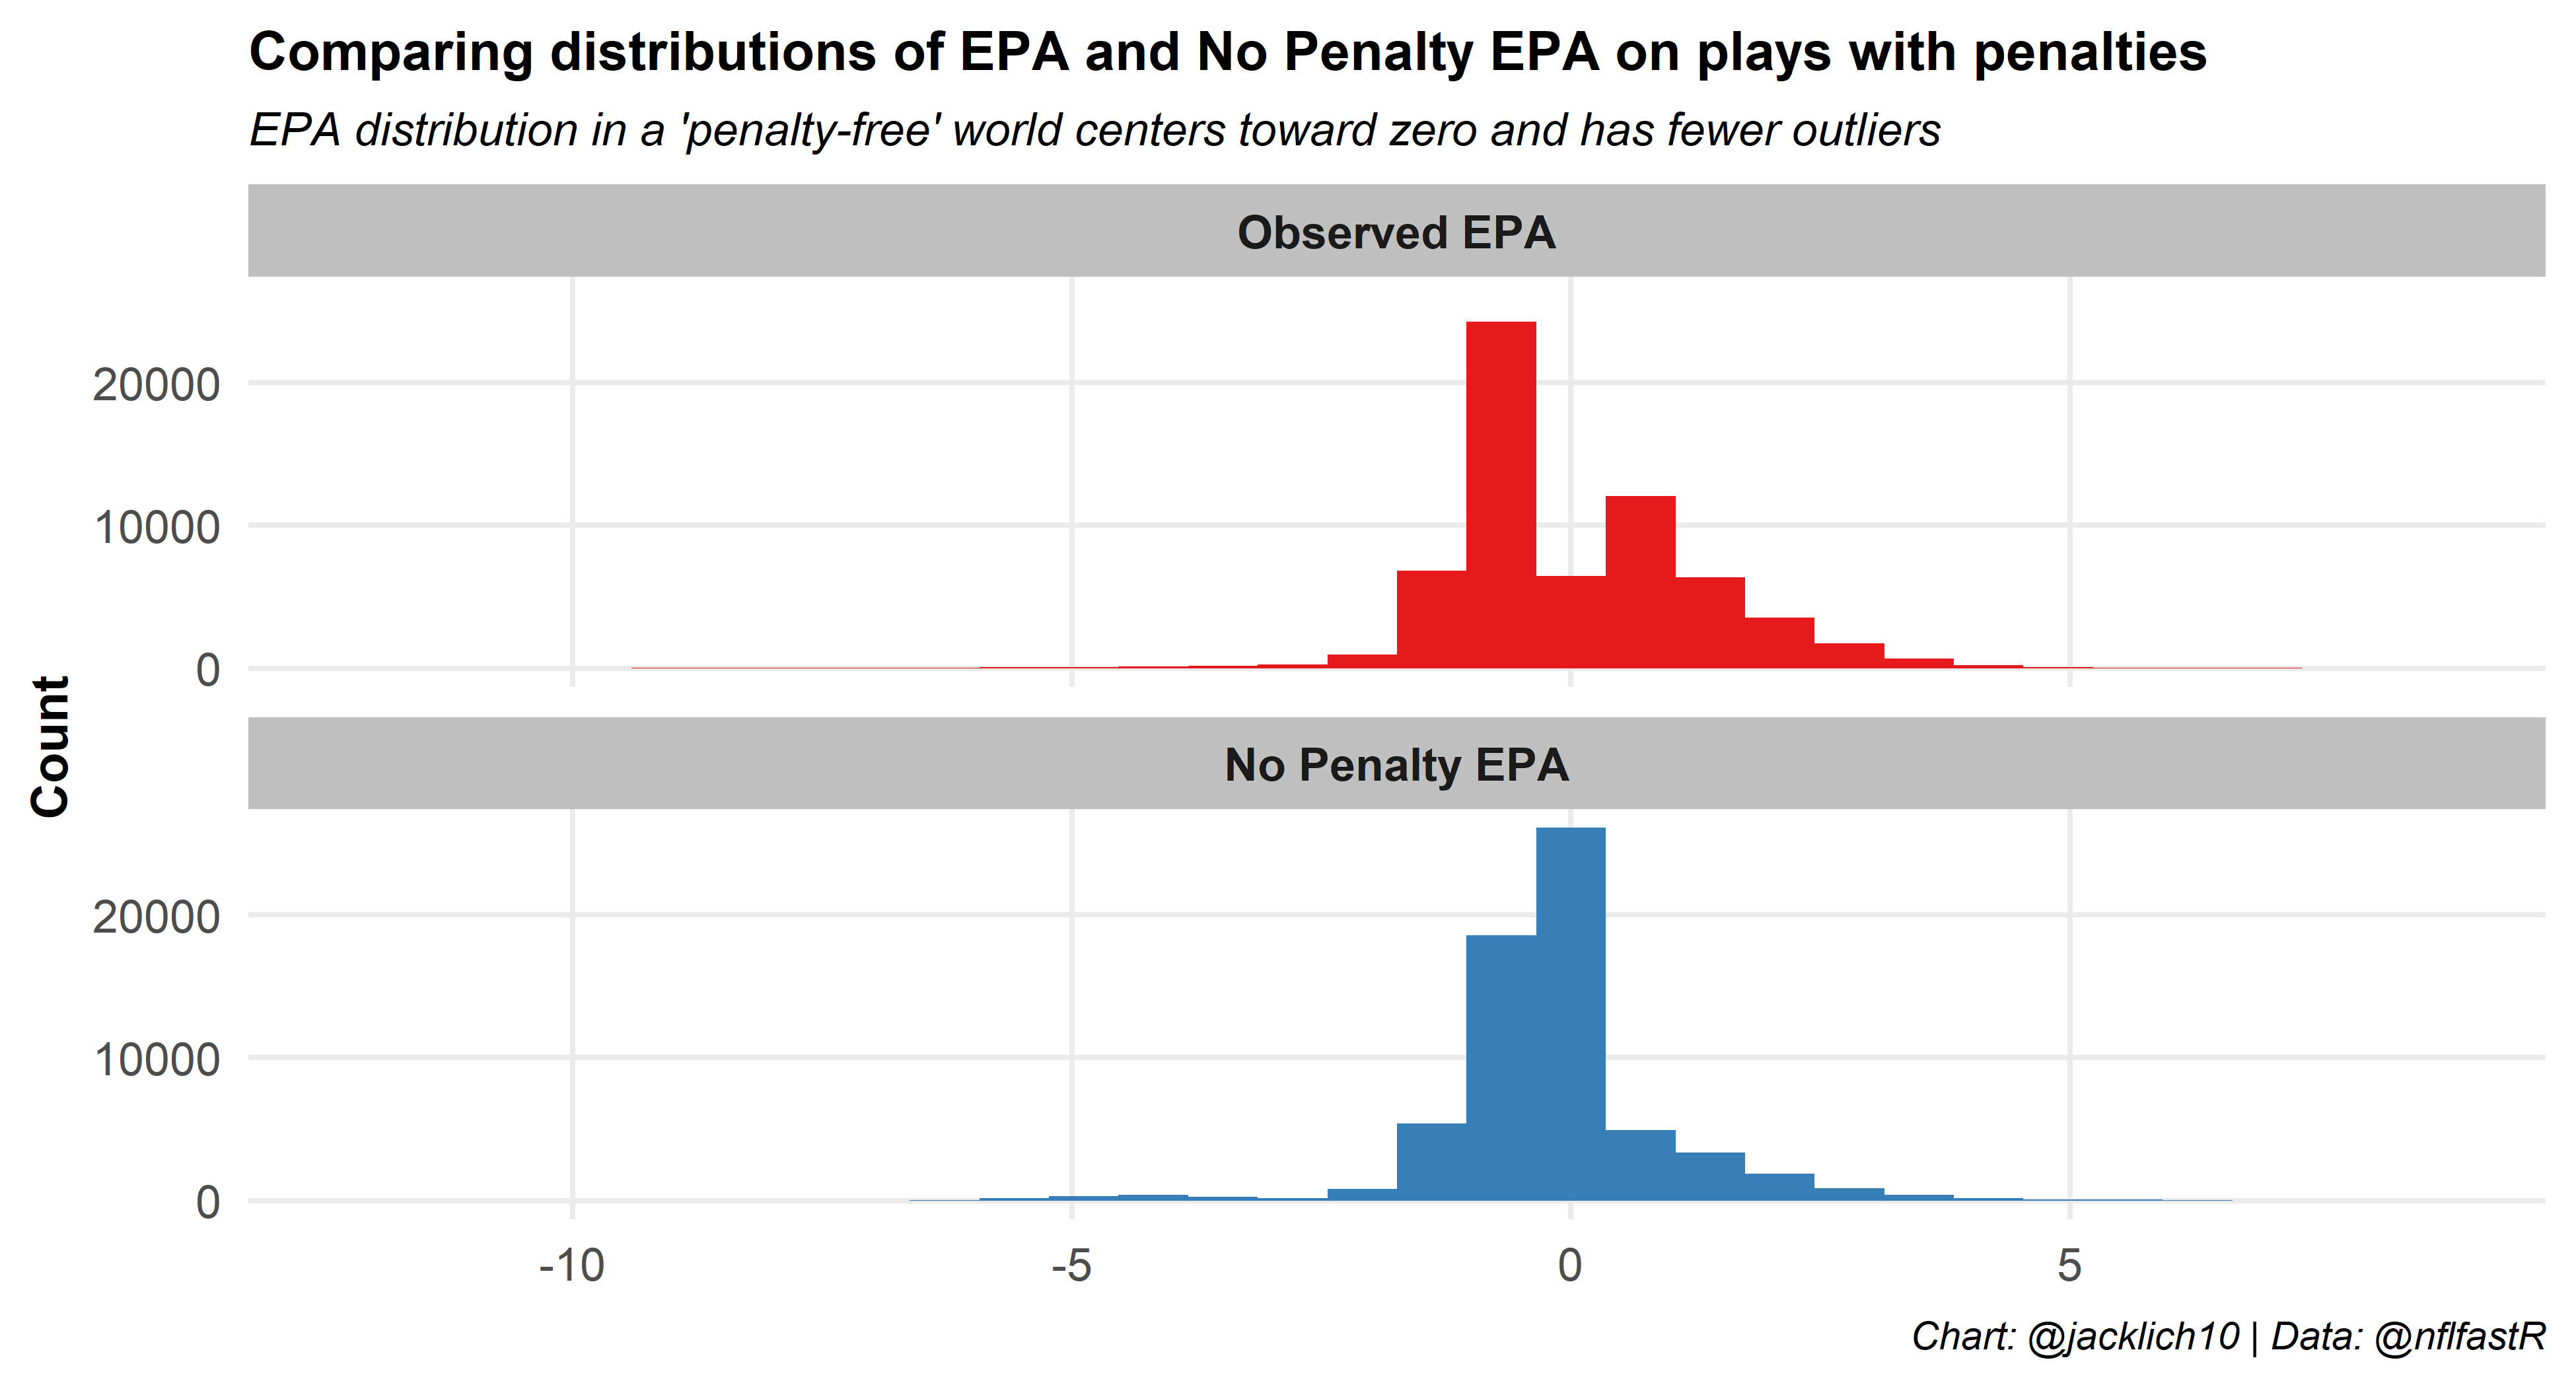
We can also examine the difference between the observed EPA and penalty-free EPA on plays with penalties by simply looking at the distributions of each. This is another way we can see that EPA on plays with penalties is highly volatile! The distribution of observed EPA has large outliers and is almost bimodal around zero (EPA on penalties is often extremely positive or extremely negative due to automatic first downs and large yardage lost or gained). These penalties can have massive influences on games! The “penalty-free” EPA smooths out a lot of this variability, as it pulls EPA towards zero. This is expected, as penalty-free EPA should align with normal values of EPA where most plays do not have significant swings in expected points.
Finally, to understand the penalty_epa and no_penalty_epa values better on an individual basis, let’s look at two plays from the Seattle Seahawks @ Arizona Cardinals game from week 7 of 2020 as an example:
| Off | Def | Dist. to Endzone | desc | Penalty | EPA | No Penalty EPA | Penalty EPA | |
|---|---|---|---|---|---|---|---|---|
 |
 |
3&5 | 88 | 1-K.Murray pass incomplete short middle to 85-D.Arnold on SEA-54-B.Wagner, Unnecessary Roughness, 15 yards, enforced at ARI 12 - No Play. | Unnecessary Roughness | 2.21 | −1.48 | 3.69 |
|
|
3&10 | 48 | 3-R.Wilson pass short left to 14-D.Metcalf for 48 yards, TOUCHDOWN NULLIFIED by Penalty on SEA-83-D.Moore, Offensive Holding, 10 yards, enforced at ARI 42. | Offensive Holding | −0.36 | 4.72 | −5.08 |
| Table: @jacklich10 | Data: @nflfastR | ||||||||
In the first play, Arizona had a 3rd and 5 on their own 12 yard line when Bobby Wagner was called for a questionable Unnecessary Roughness penalty. This play generated around 2.21 expected points. Using our methodology, we can see that had no penalty been called, the play would have lost about 1.48 expected points. Therefore, we can conclude that the penalty generated roughly 3.69 expected points (2.21 - (-1.48)) on its own!
The second play is an Offensive Holding call that cost the Seahawks more than 5 expected points when DK Metcalf scored a long touchdown on 3rd and 10 that was called back.
Leveraging instability of penalties for prediction
It is fair to wonder from the two plays above, did the Cardinals really earn that first down or earn the Offensive Holding call on defense, or was it simply a bit of randomness that swung their way? With regard to predicting future performance, it might be best to look at no_penalty_epa rather than epa, as it hopefully can do a better job of teasing out the fluky-ness of the penalties.
In order to leverage this information, we will try to predict game outcomes using the methodology I outlined in my previous post. In short, we will convert each EPA statistic into a lagging moving average using a dynamic window that starts at 10 games. The lag ensures that we compare a team’s performance against their opponent’s performance up to that point in the season. The dynamic window works such that we will use a ten game window to predict the winner of the 11th game in a season, but for say the 15th game in a season, we will use a 14 game window. We will also make use of exponential and running moving averages for different EPA measures, as we found these to be the most predictive versions of EPA in the post.
As a baseline, we will explore the predictive power of EPA before altering EPA for penalties as well as the predictive power of EPA in a completely “penalty-free” environment. Then, we will play around with different ways of manipulating penalty EPA to try to come up with more predictive measures. For example, we will try to penalize offenses for False Start penalties (recall these are the most stable) while living in a “penalty-free” world for all other penalties.
Note that pre-snap penalties like False Start and Delay of Game in the @nflfastR database occur when qb_dropback is zero - as such, they will fall under “Rush EPA”.
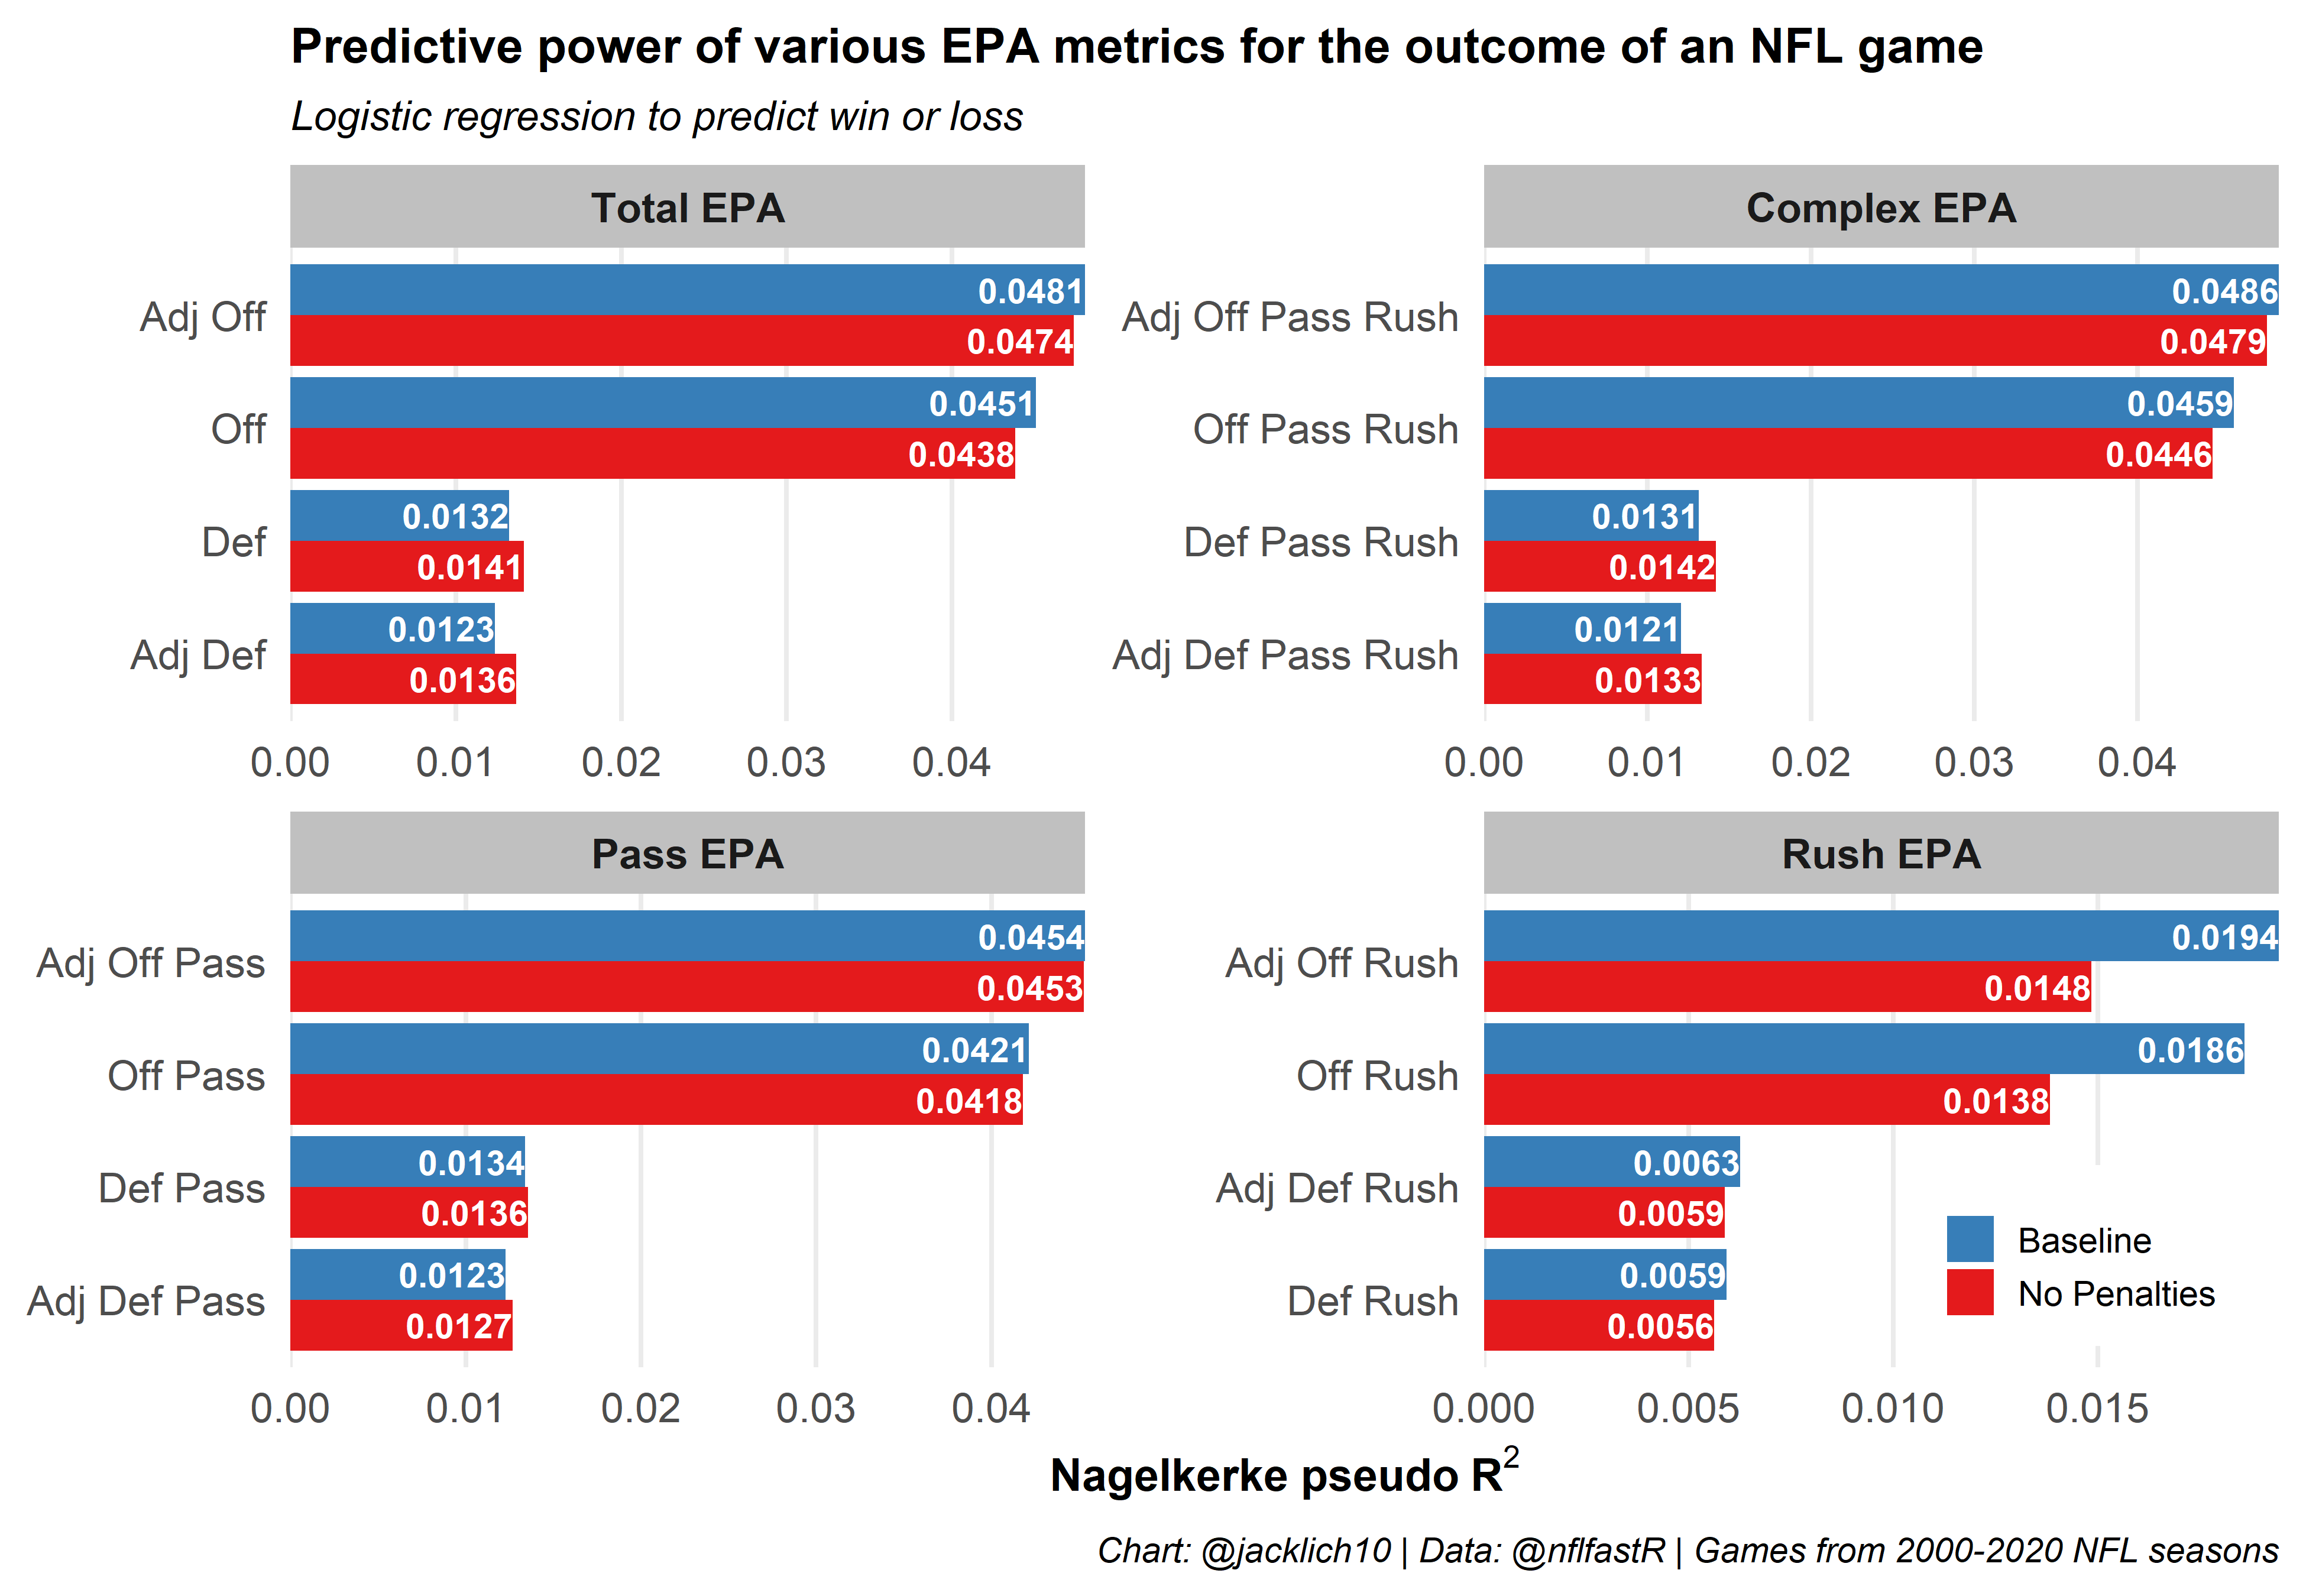
Comparing the predictive power of baseline EPA to “penalty-free” EPA, we notice that:
- Penalties (at least certain types) do carry some signal, as we lose predictive power when removing them from the equation
- Eliminating the effects of penalties for offenses, especially pre-snap penalties, significantly decreases its predictive power when there is no QB dropback (Rush EPA)
- Eliminating the effects of penalties for defenses mostly increases its predictive power (this aligns with what we saw earlier - that defenses rarely control their penalty rates)
This initial exploration gels nicely with our discoveries earlier, mainly that offenses control penalty rates more than defenses. As such, removing penalties from the equation causes offensive strength metrics to lose signal and defensive strength metrics to gain signal by eliminating some noise.
Next, let’s try to only account for penalties that we know are at least somewhat stable for teams over time. Specifically, we will account for False Start, Offensive Holding, and Defensive Offside penalties for the offense as well as account for Defensive Offside and Defensive Pass Interference penalties for the defense. To be clear, this means that for the penalties listed above, we will use the observed EPA, while on all other penalties we will use our calculated “penalty-free” EPA.
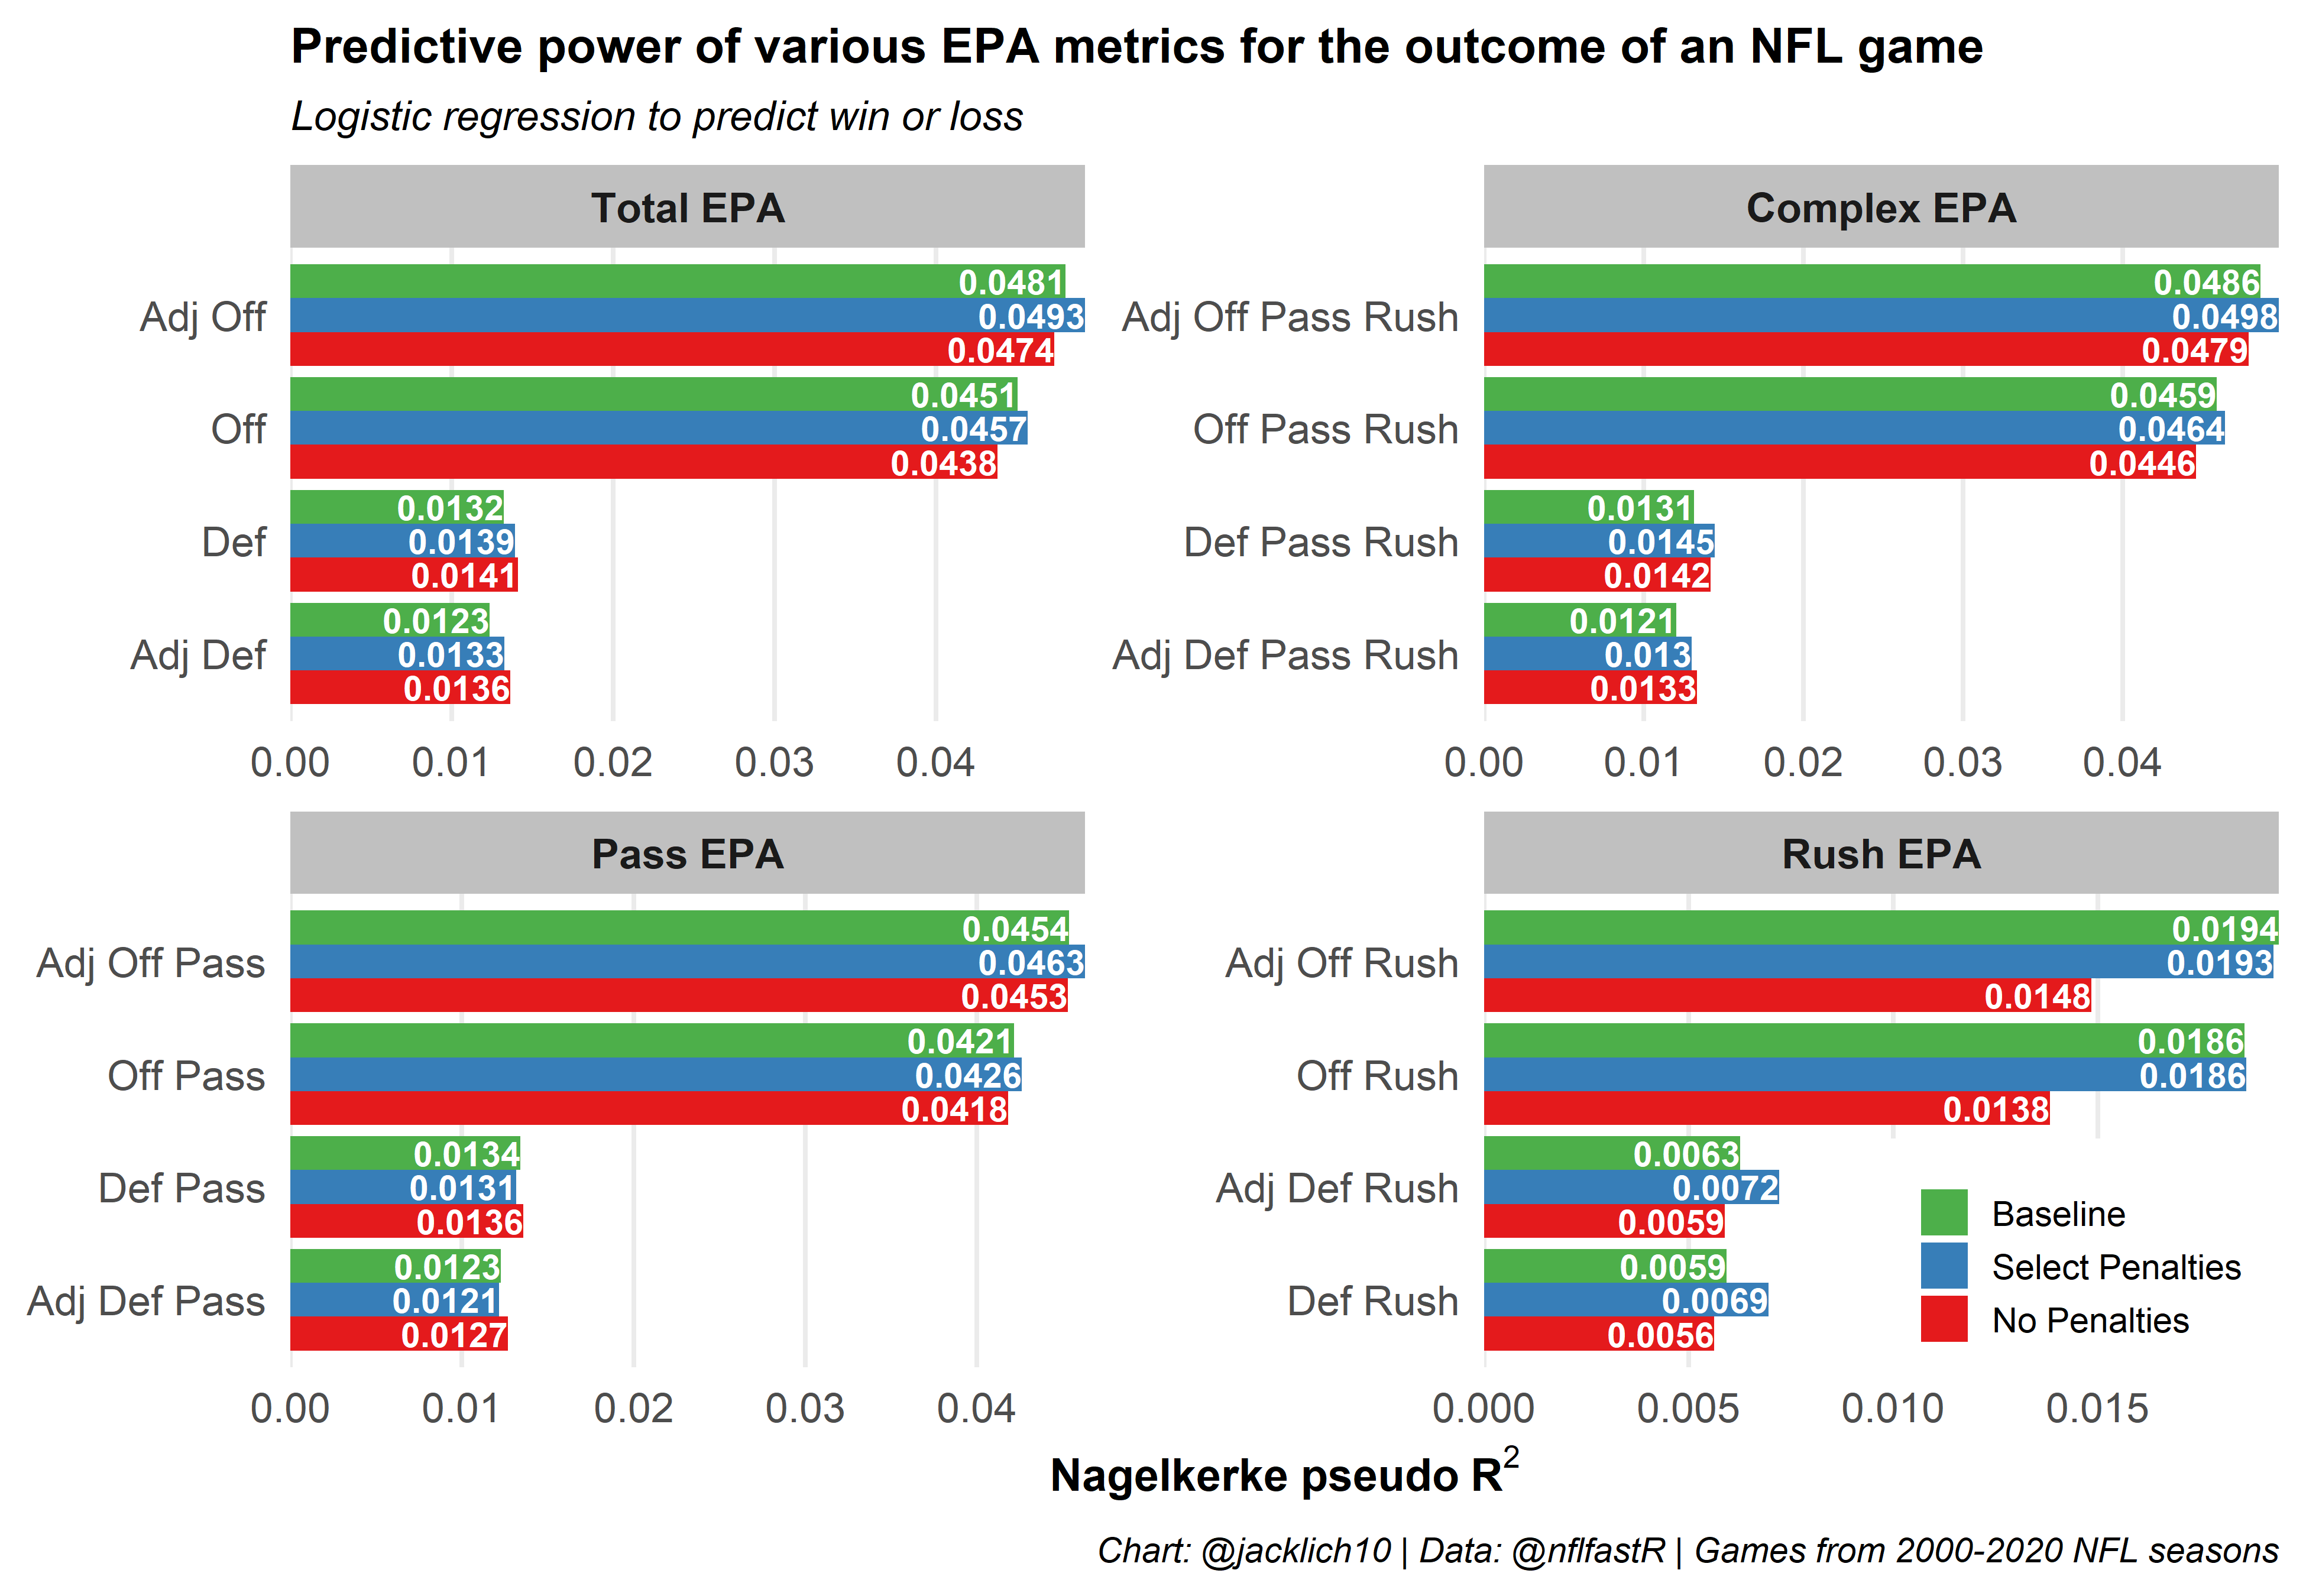
Awesome! While we failed to achieve the predictive power of baseline rush EPA for offenses, in almost every other category of predictor we increased the signal of EPA metrics, including both total offense and total defense EPA. In other words, when we only use the observed EPA for the more stable penalty types outlined above and use the calculated EPA in a “penalty-free” world otherwise, we can better predict future performance!
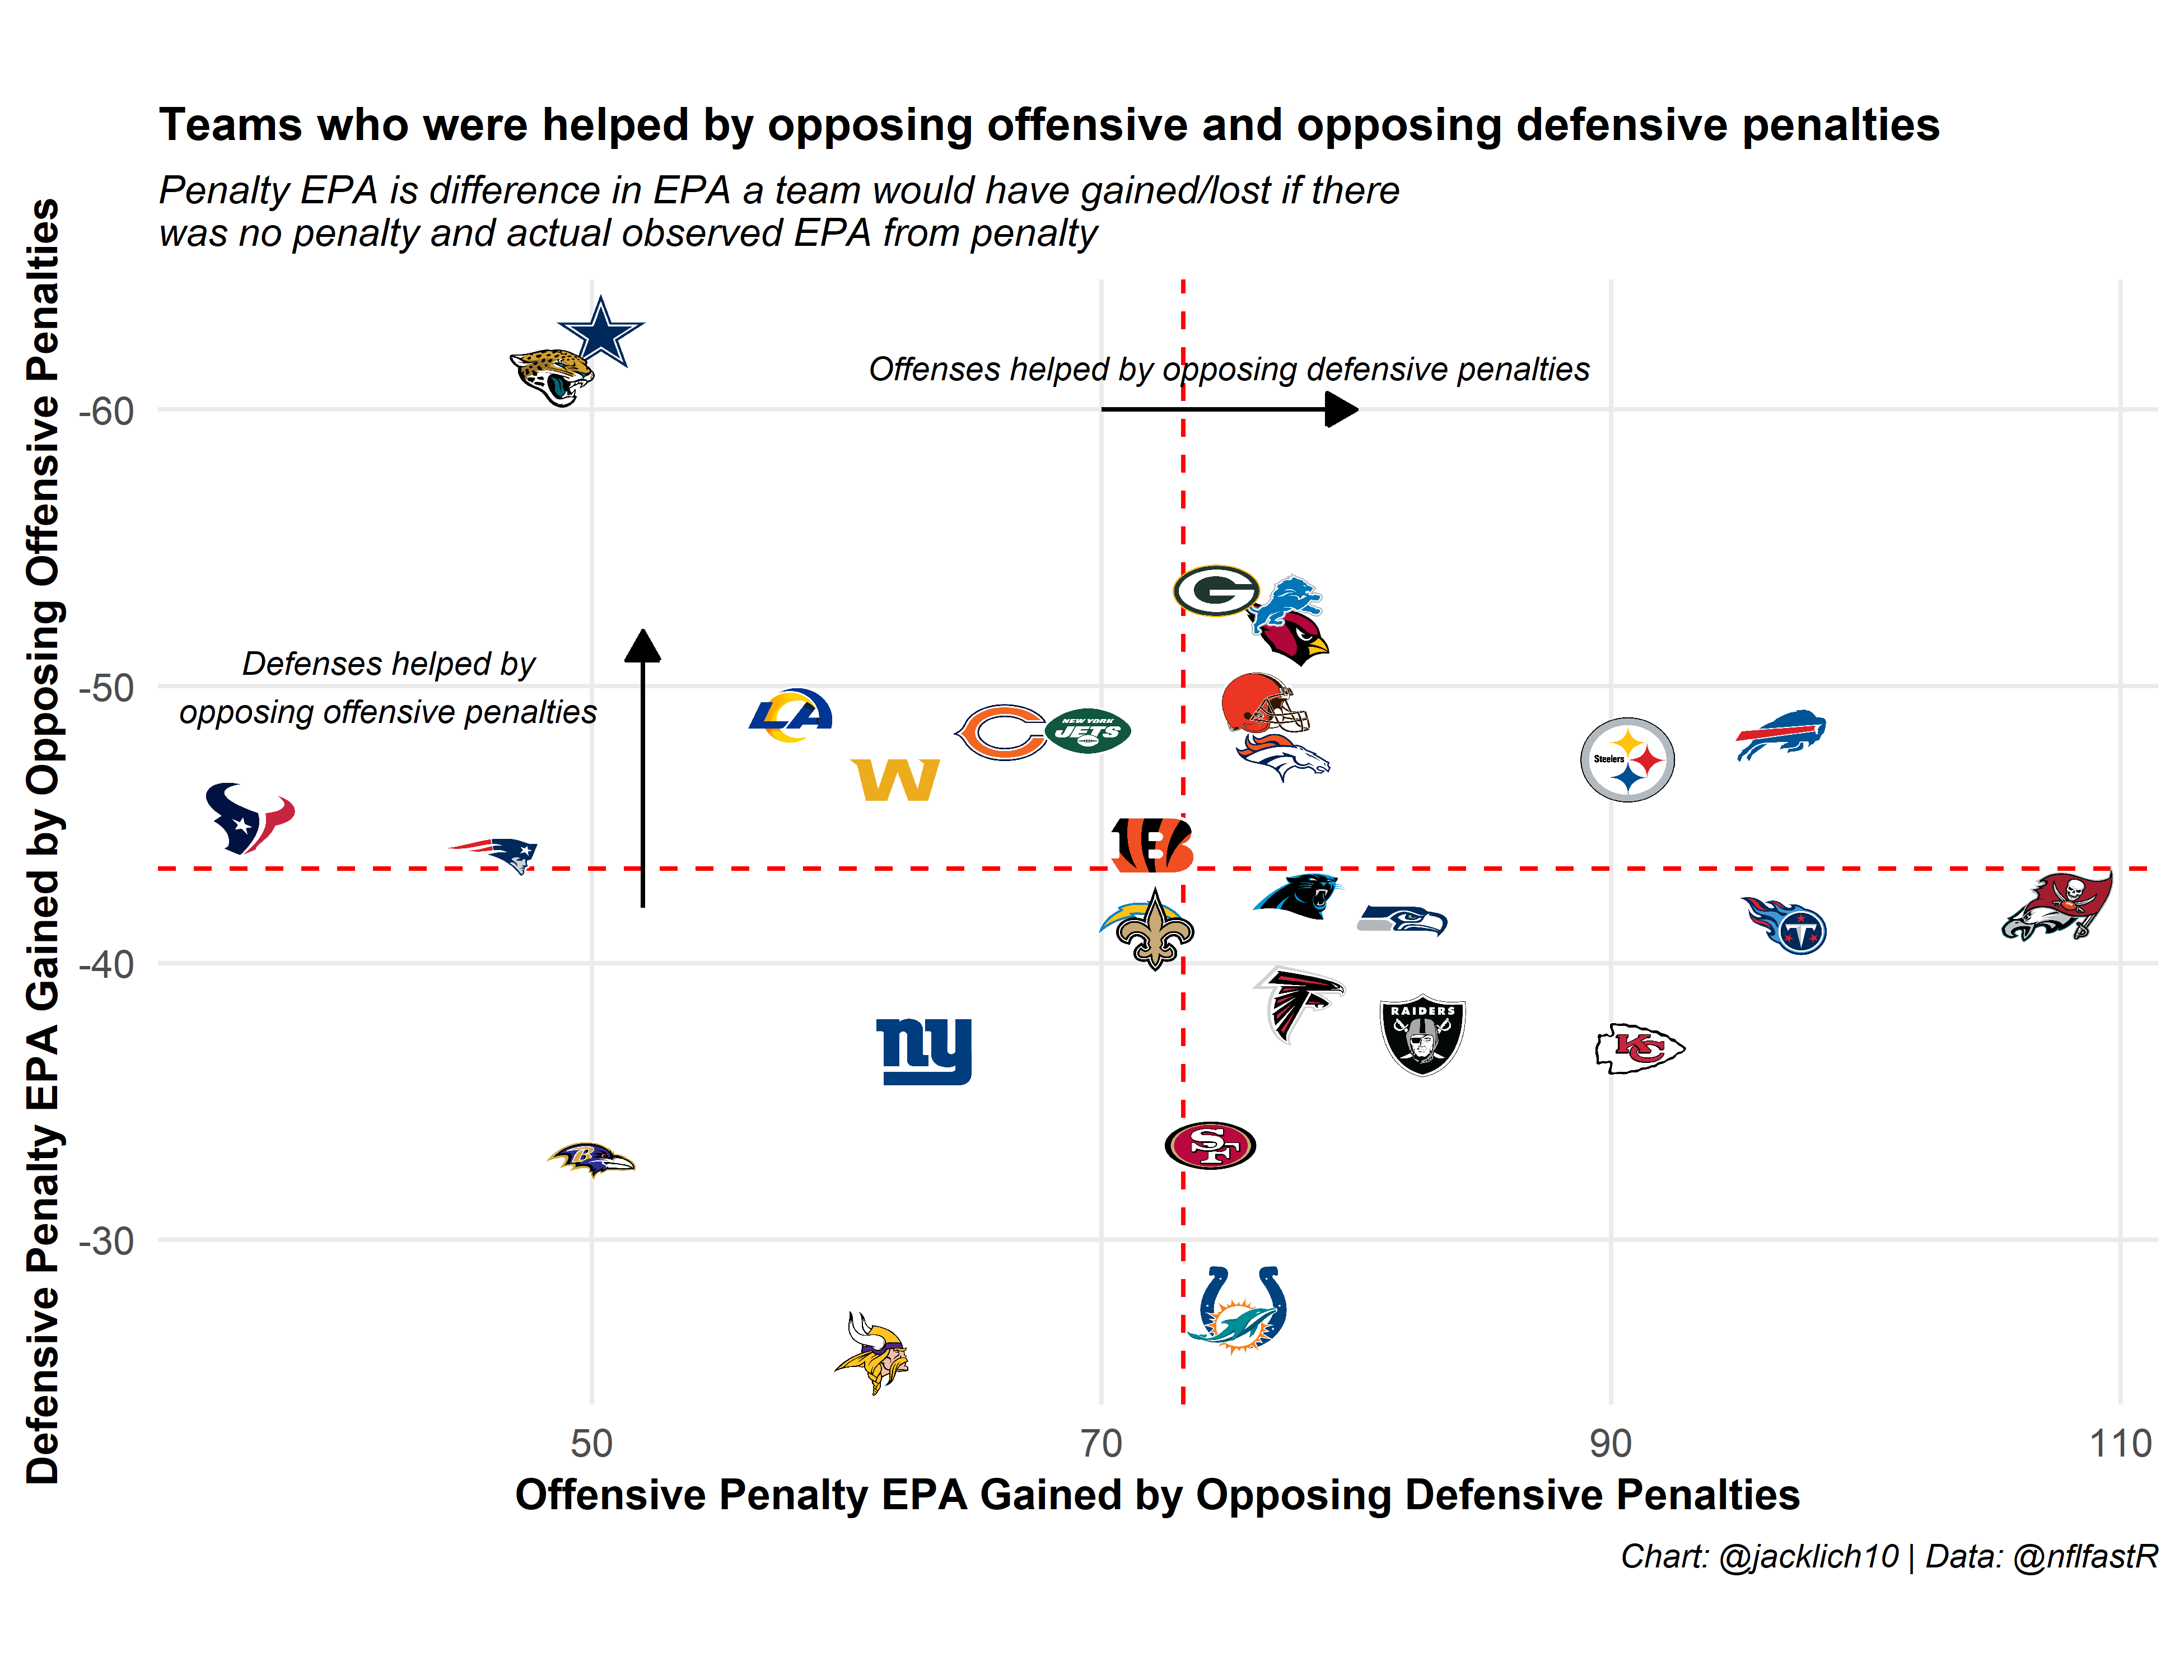
For fun, let’s examine the offenses that were helped most by opposing defensive penalties as well as defenses that were helped most by opposing offensive penalties in 2020. We see that Tampa Bay’s and Philadelphia’s offenses were helped out most by opposing defensive penalties while Dallas’ and Jacksonville’s defenses were helped by opposing offensive penalties.
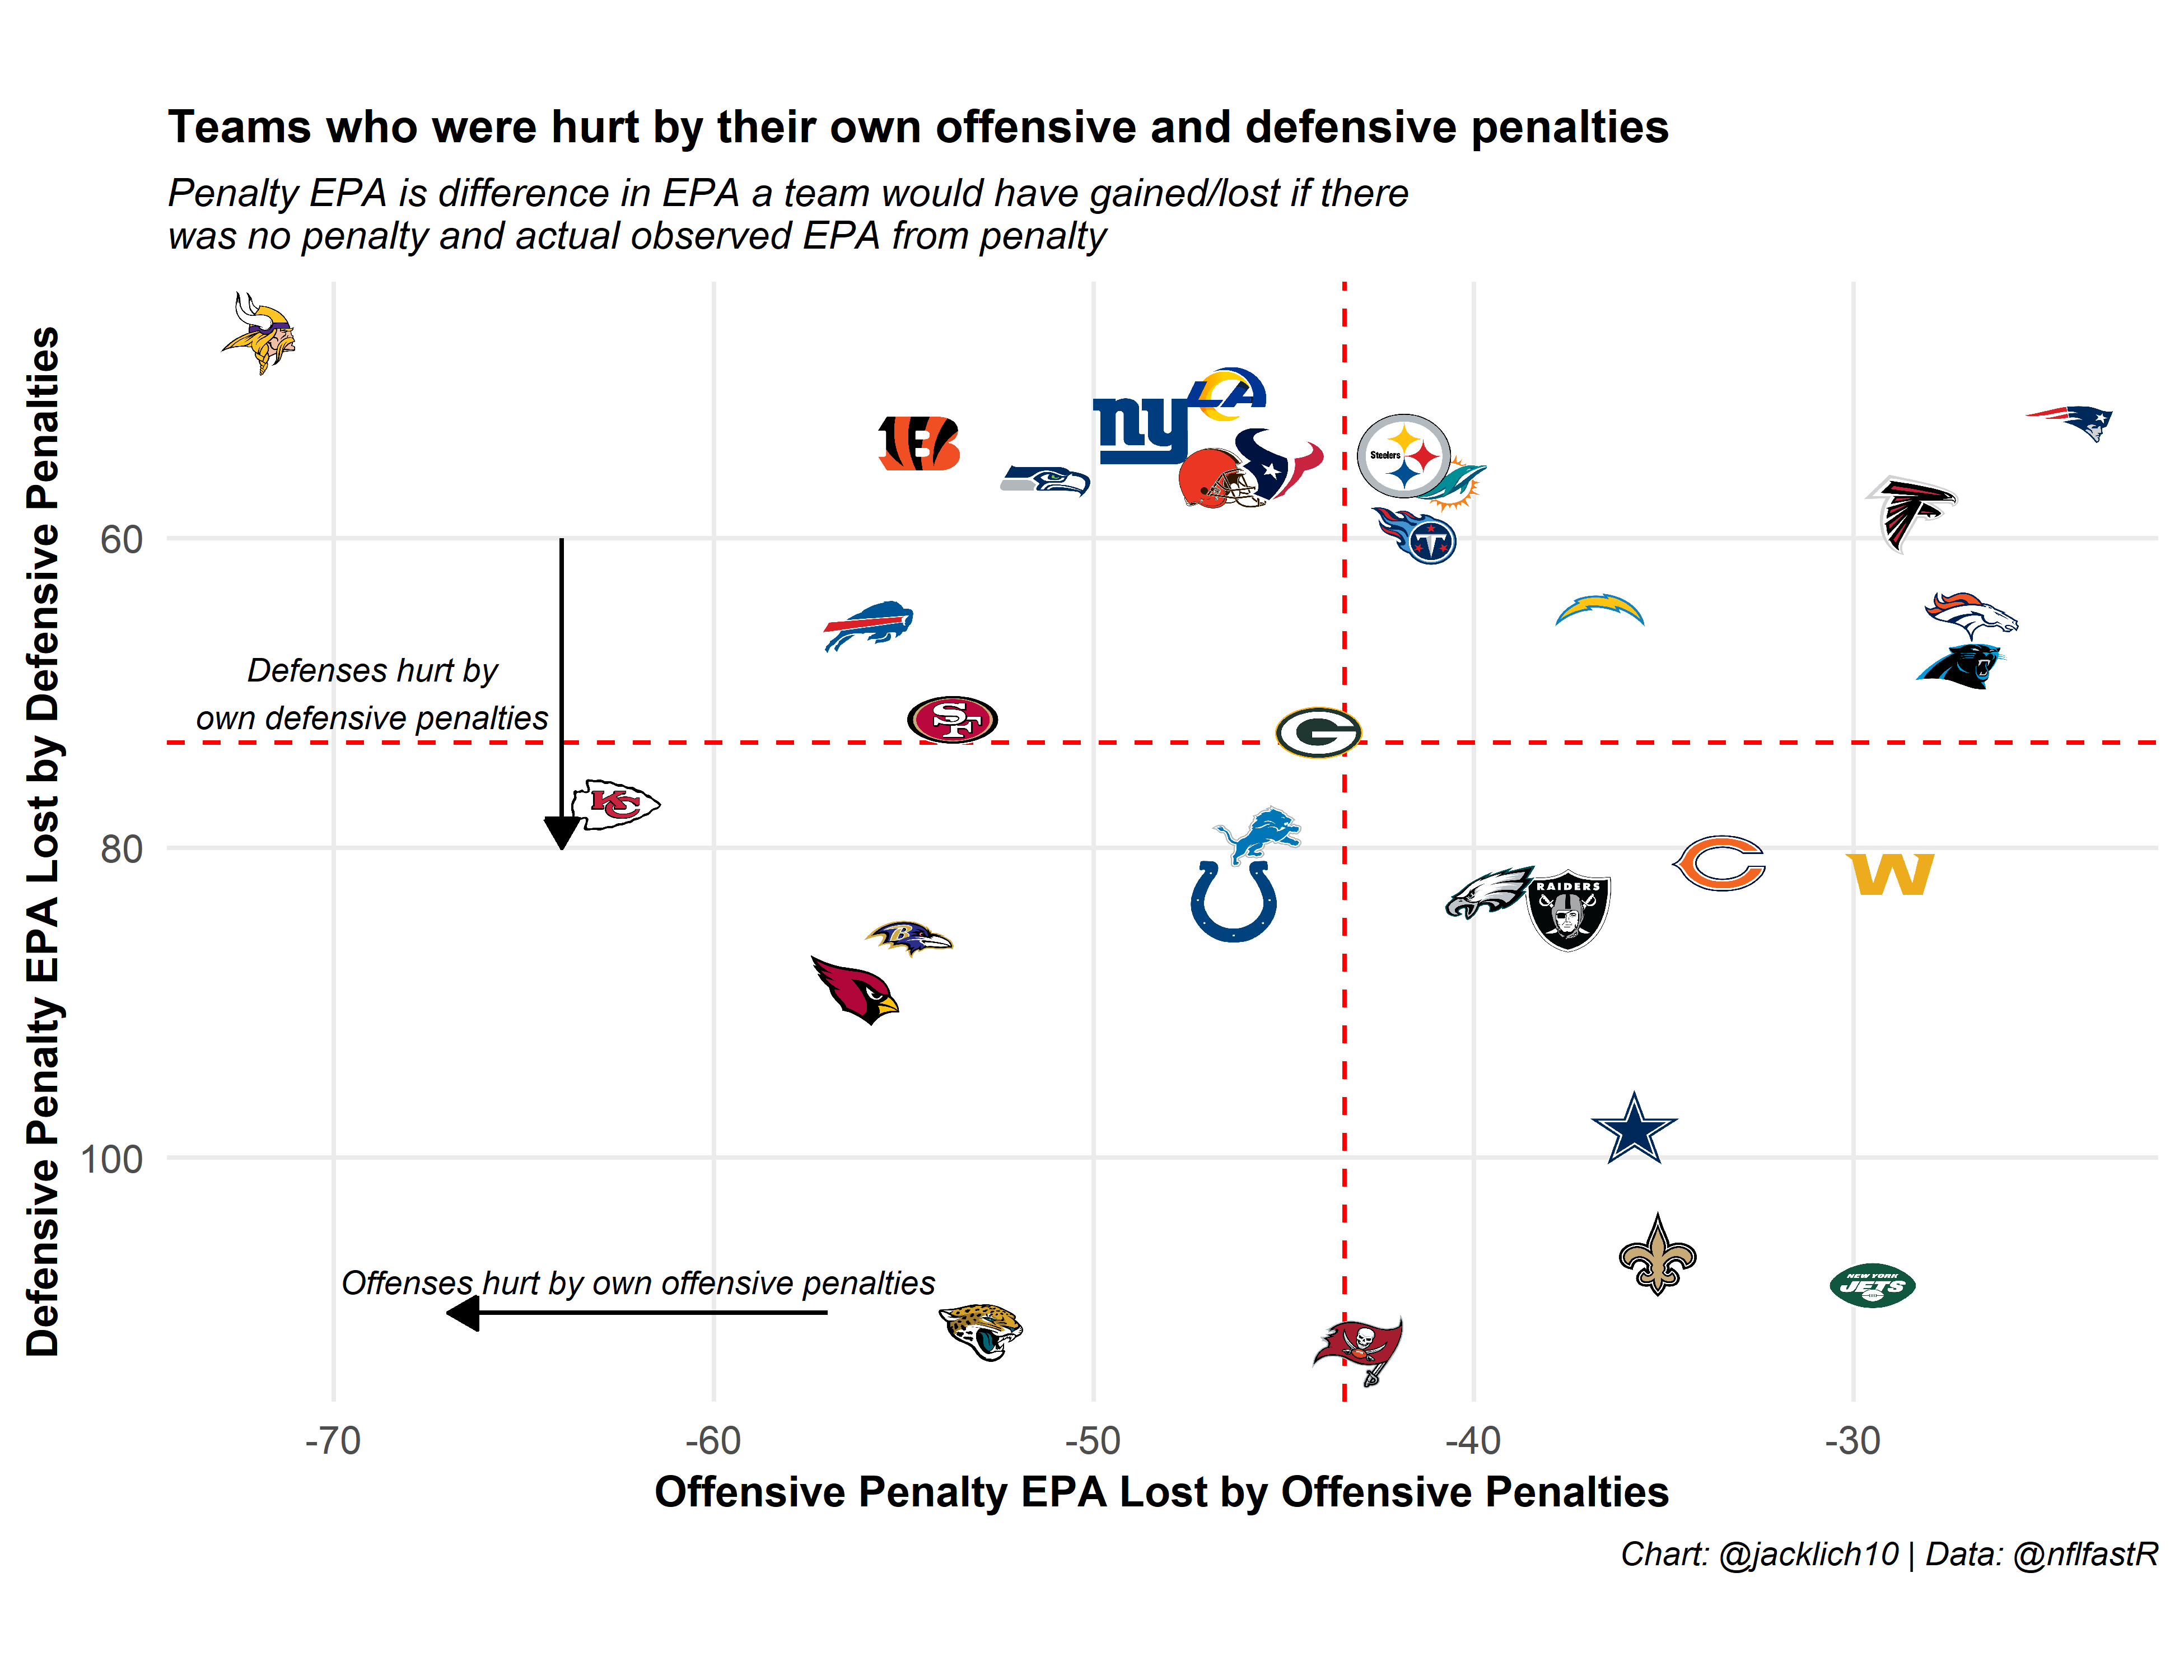
Similarly, a look at the offenses that hurt themselves the most with penalties as well as defenses that hurt themselves the most with penalties. We see that Minnesota and Kansas City’s offenses lost the most EPA from offensive penalties while Tampa Bay’s and Jacksonville’s defenses lost the most EPA from defensive penalties.
Note that for an offense like the Jets, while they lost a marginal amount of EPA from their own offensive penalties, this is primarily due to the fact that their penalties did not negate any explosive plays. This is in contrast to a team like the Patriots, who lost the least EPA from their own offensive and defensive penalties due to committing very few penalties in the first place.
Final Thoughts
While I played around with various configurations of penalty types to include/not include as signal or noise, this was not a rigorous process. It is possible that a different approach to handling penalty EPA will yield greater strides in predictive power. For example, I played around with weighting observed EPA and “penalty-free” EPA for certain penalty types, though did not find any predictive benefits. One could also experiment with regressing “penalty-free” EPA differently depending on penalty type. Maybe for more stable penalties like False Starts, “penalty-free” EPA should be regressed slightly, while flukier penalties could be regressed more.
Generally, due to the rarity and volatility of penalties, adjusting EPA metrics to improve predictive power on plays with penalties is very difficult. Further, as we saw from the stability of team penalty percentages over time, the NFL is non-stationary. It is possible that certain penalty types will become more or less stable over time, and there is always the possibility of NFL rule changes or points of emphasis (like calling very few Holding penalties in 2020) that alter the NFL landscape. Hopefully, the penalty EPA methodology can be refined and explored further by the community in the future.