The latest version of nflfastR added back the ability to join roster data so I decided to take a look at receiving by position; I particularly wondered if there had been any noticeable increase in TE usage in the passing game over the years.
First up we are going to grab the play-by-play data and roster data and merge them to get the receiving player’s position.
seasons <- 2000:2019
pbp <- purrr::map_df(seasons, function(x) {
  readRDS(
    url(
      paste0("https://raw.githubusercontent.com/guga31bb/nflfastR-data/master/data/play_by_play_", x, ".rds")
    )
  )
})
pbp <- as.data.table(pbp)
# These decoding is incredibly slow
# Decode the player_ids to the old-style gsis_id
# Filter only plays with a receiver_id and non-NA epa
pbp <- pbp[!is.na(receiver_id) & !is.na(epa)]
rec_pbp <- decode_player_ids(pbp)
rec_pbp <- rec_pbp[!is.na(receiver_id)]
# Get the rosters and filter out anything missing a gsis_id
rosters <- as.data.table(nflfastR::fast_scraper_roster(seq(2000, 2019), pp = TRUE))
roster_subset <- rosters[!is.na(gsis_id), .N, by = "season,gsis_id,team,position"]
# Join pbp with the rosters and create a recpos column
rec_pbp[roster_subset, recpos := i.position, on = .(receiver_id = gsis_id, season = season)]
# Filter for plays where the receiver is one of the 4 normal offensive receiving positions and select a subset of columns
rec_pbp <- rec_pbp[recpos %in% c("WR", "TE", "RB", "FB"), .(season, recpos, epa, air_yards, complete_pass, posteam, pass_location, yardline_100)]
# Create a summary table by season/position
recsumm <- rec_pbp[,
  .(
    mean_epa = mean(epa),
    tot_epa = sum(epa),
    mean_ay = mean(air_yards, na.rm = T),
    tot_ay = sum(air_yards, na.rm = T),
    tgt = .N,
    cp = sum(complete_pass) / .N
  ),
  by = "season,recpos"
]
# Make the recpos a factor for ordering in plots
recsumm[, recpos := factor(recpos, levels = c("WR", "TE", "RB", "FB"))]
So now we have the data let’s see what difference there is in usage by position.
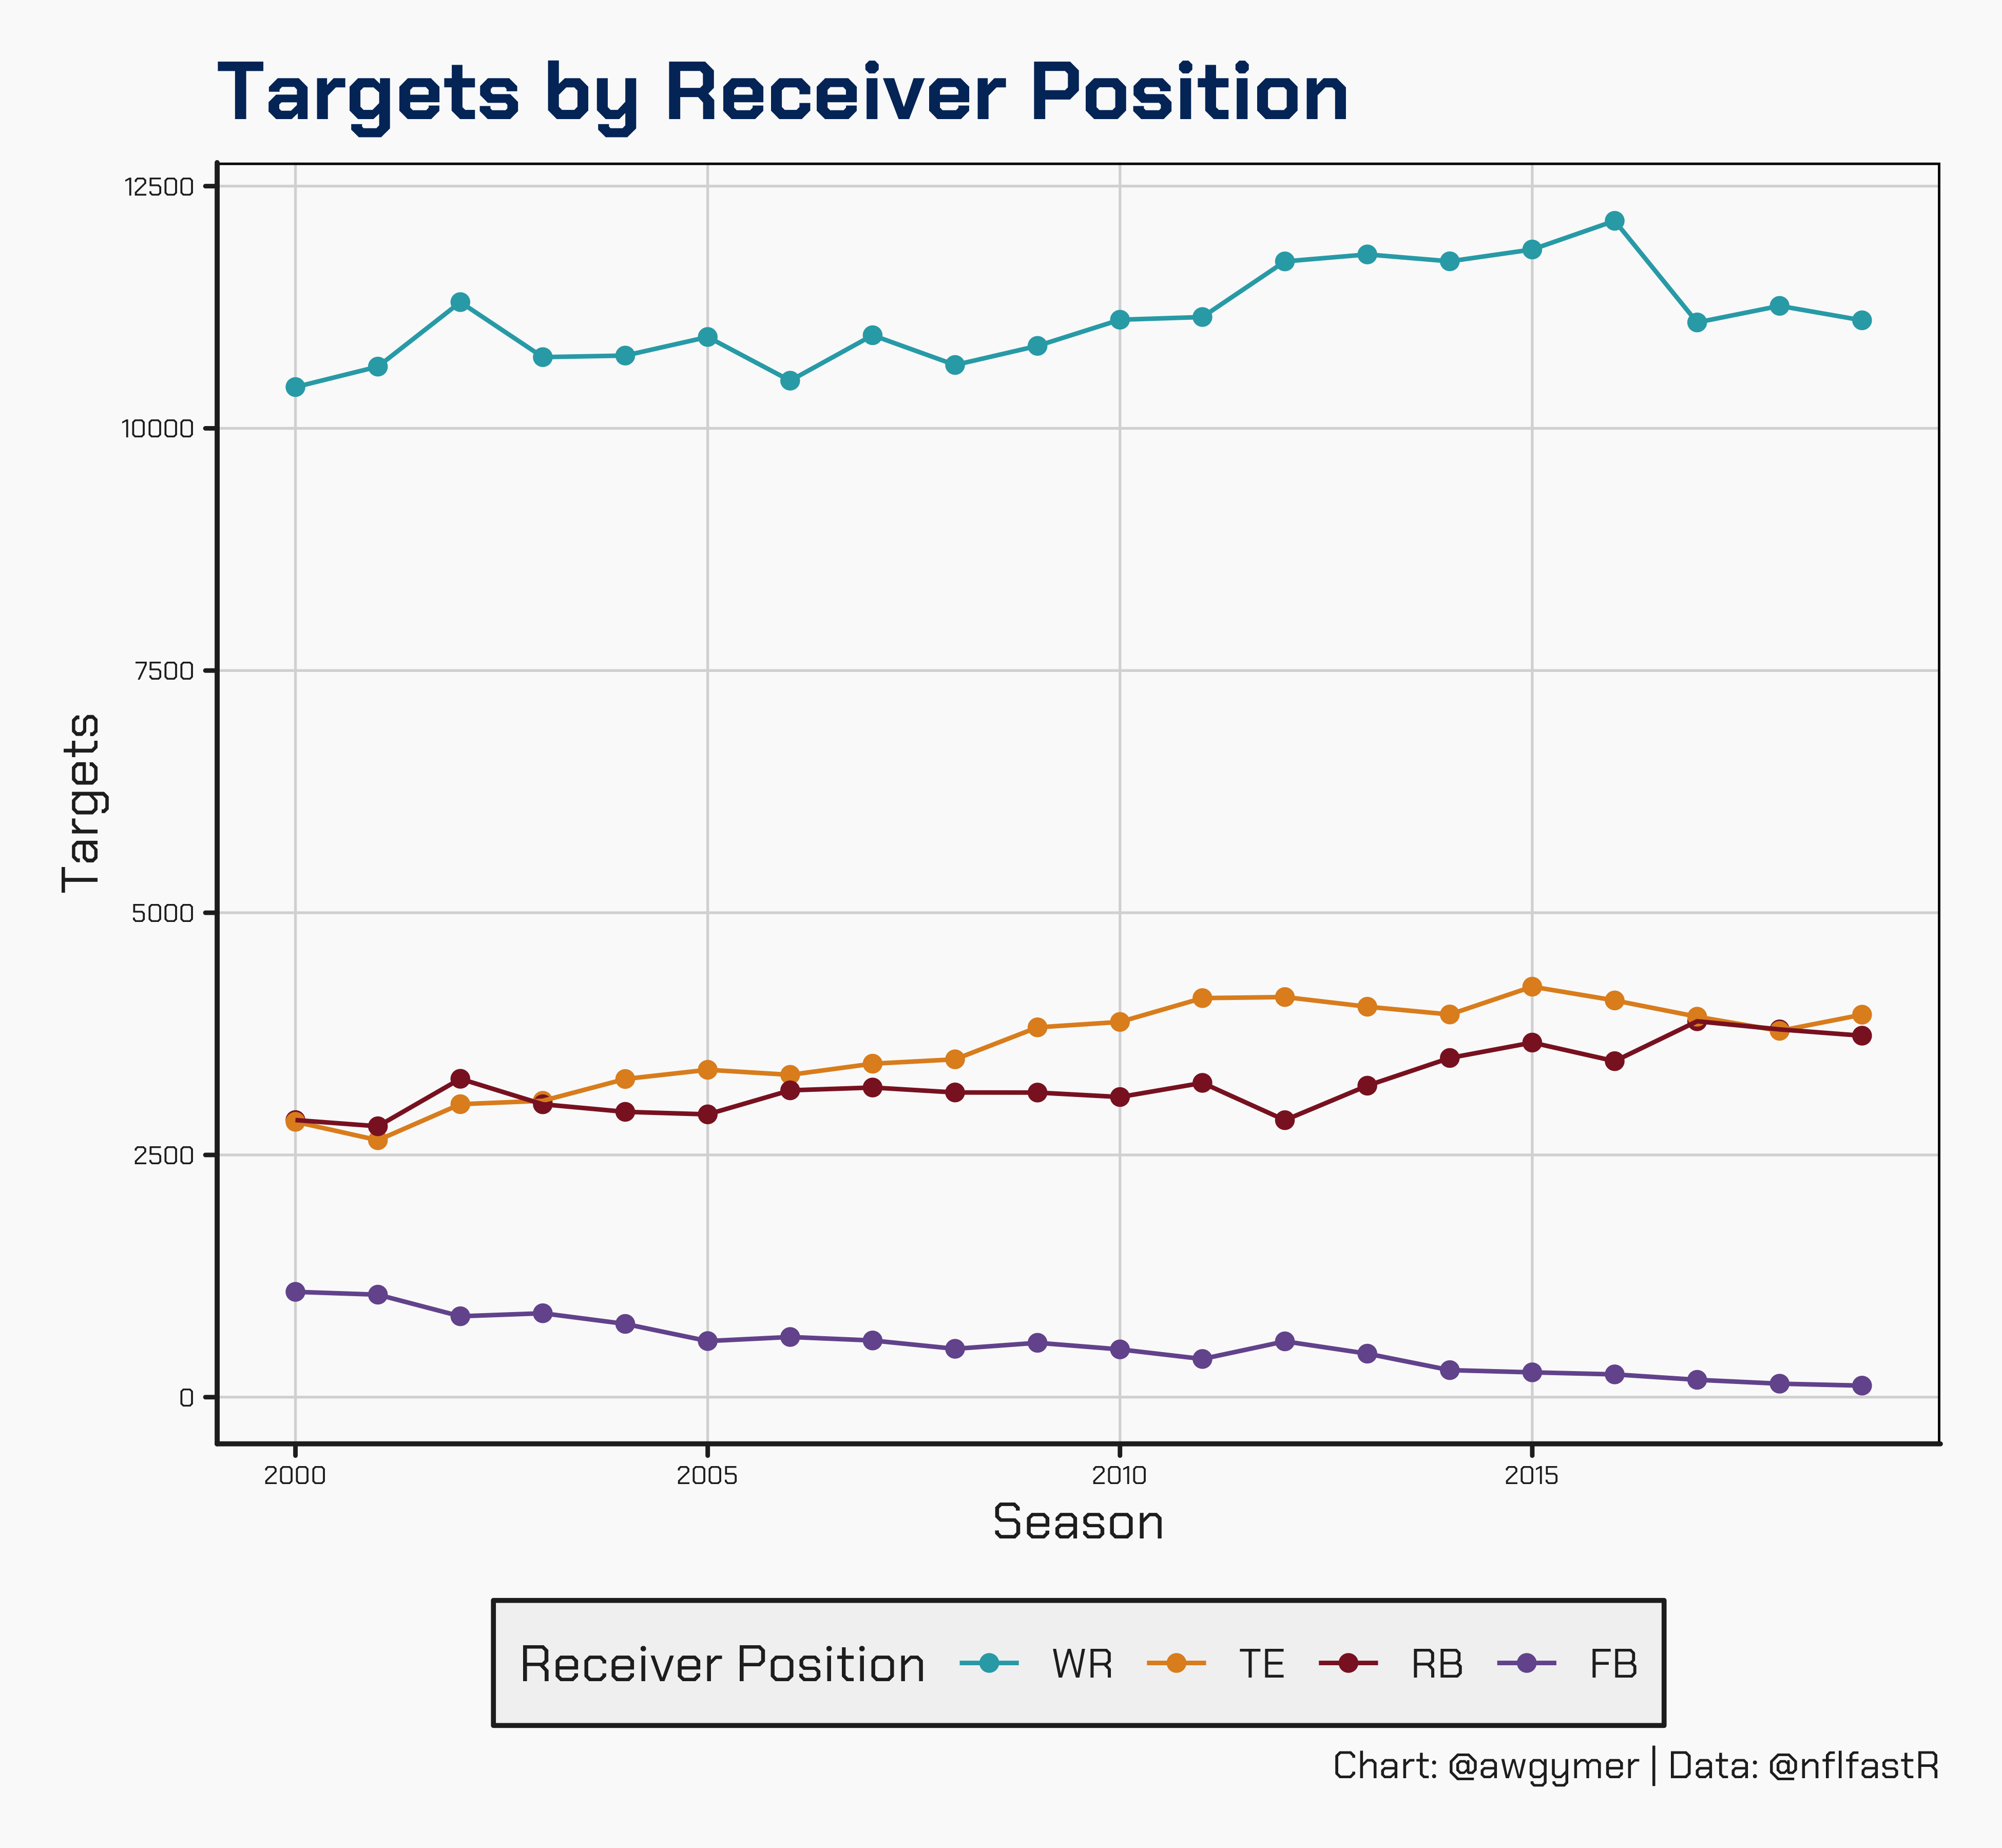
It looks like the last 20 years have seen a steady increase in targets for TEs and a large drop off in targets to fullbacks. There’s an interesting reduction in targets to WRs across the past 3 seasons after small rise over the previous decade and I don’t have a good explanation for that.
Looking at the total EPA accumulated by each position shows a similar rise for TEs and really highlights how using RBs in the passing game isn’t particularly effective; despite having similar numbers of targets to TEs their season-long EPA is next to nothing. Interestingly WR EPA in the past 2 seasons is at its highest despite the reduction in targets.
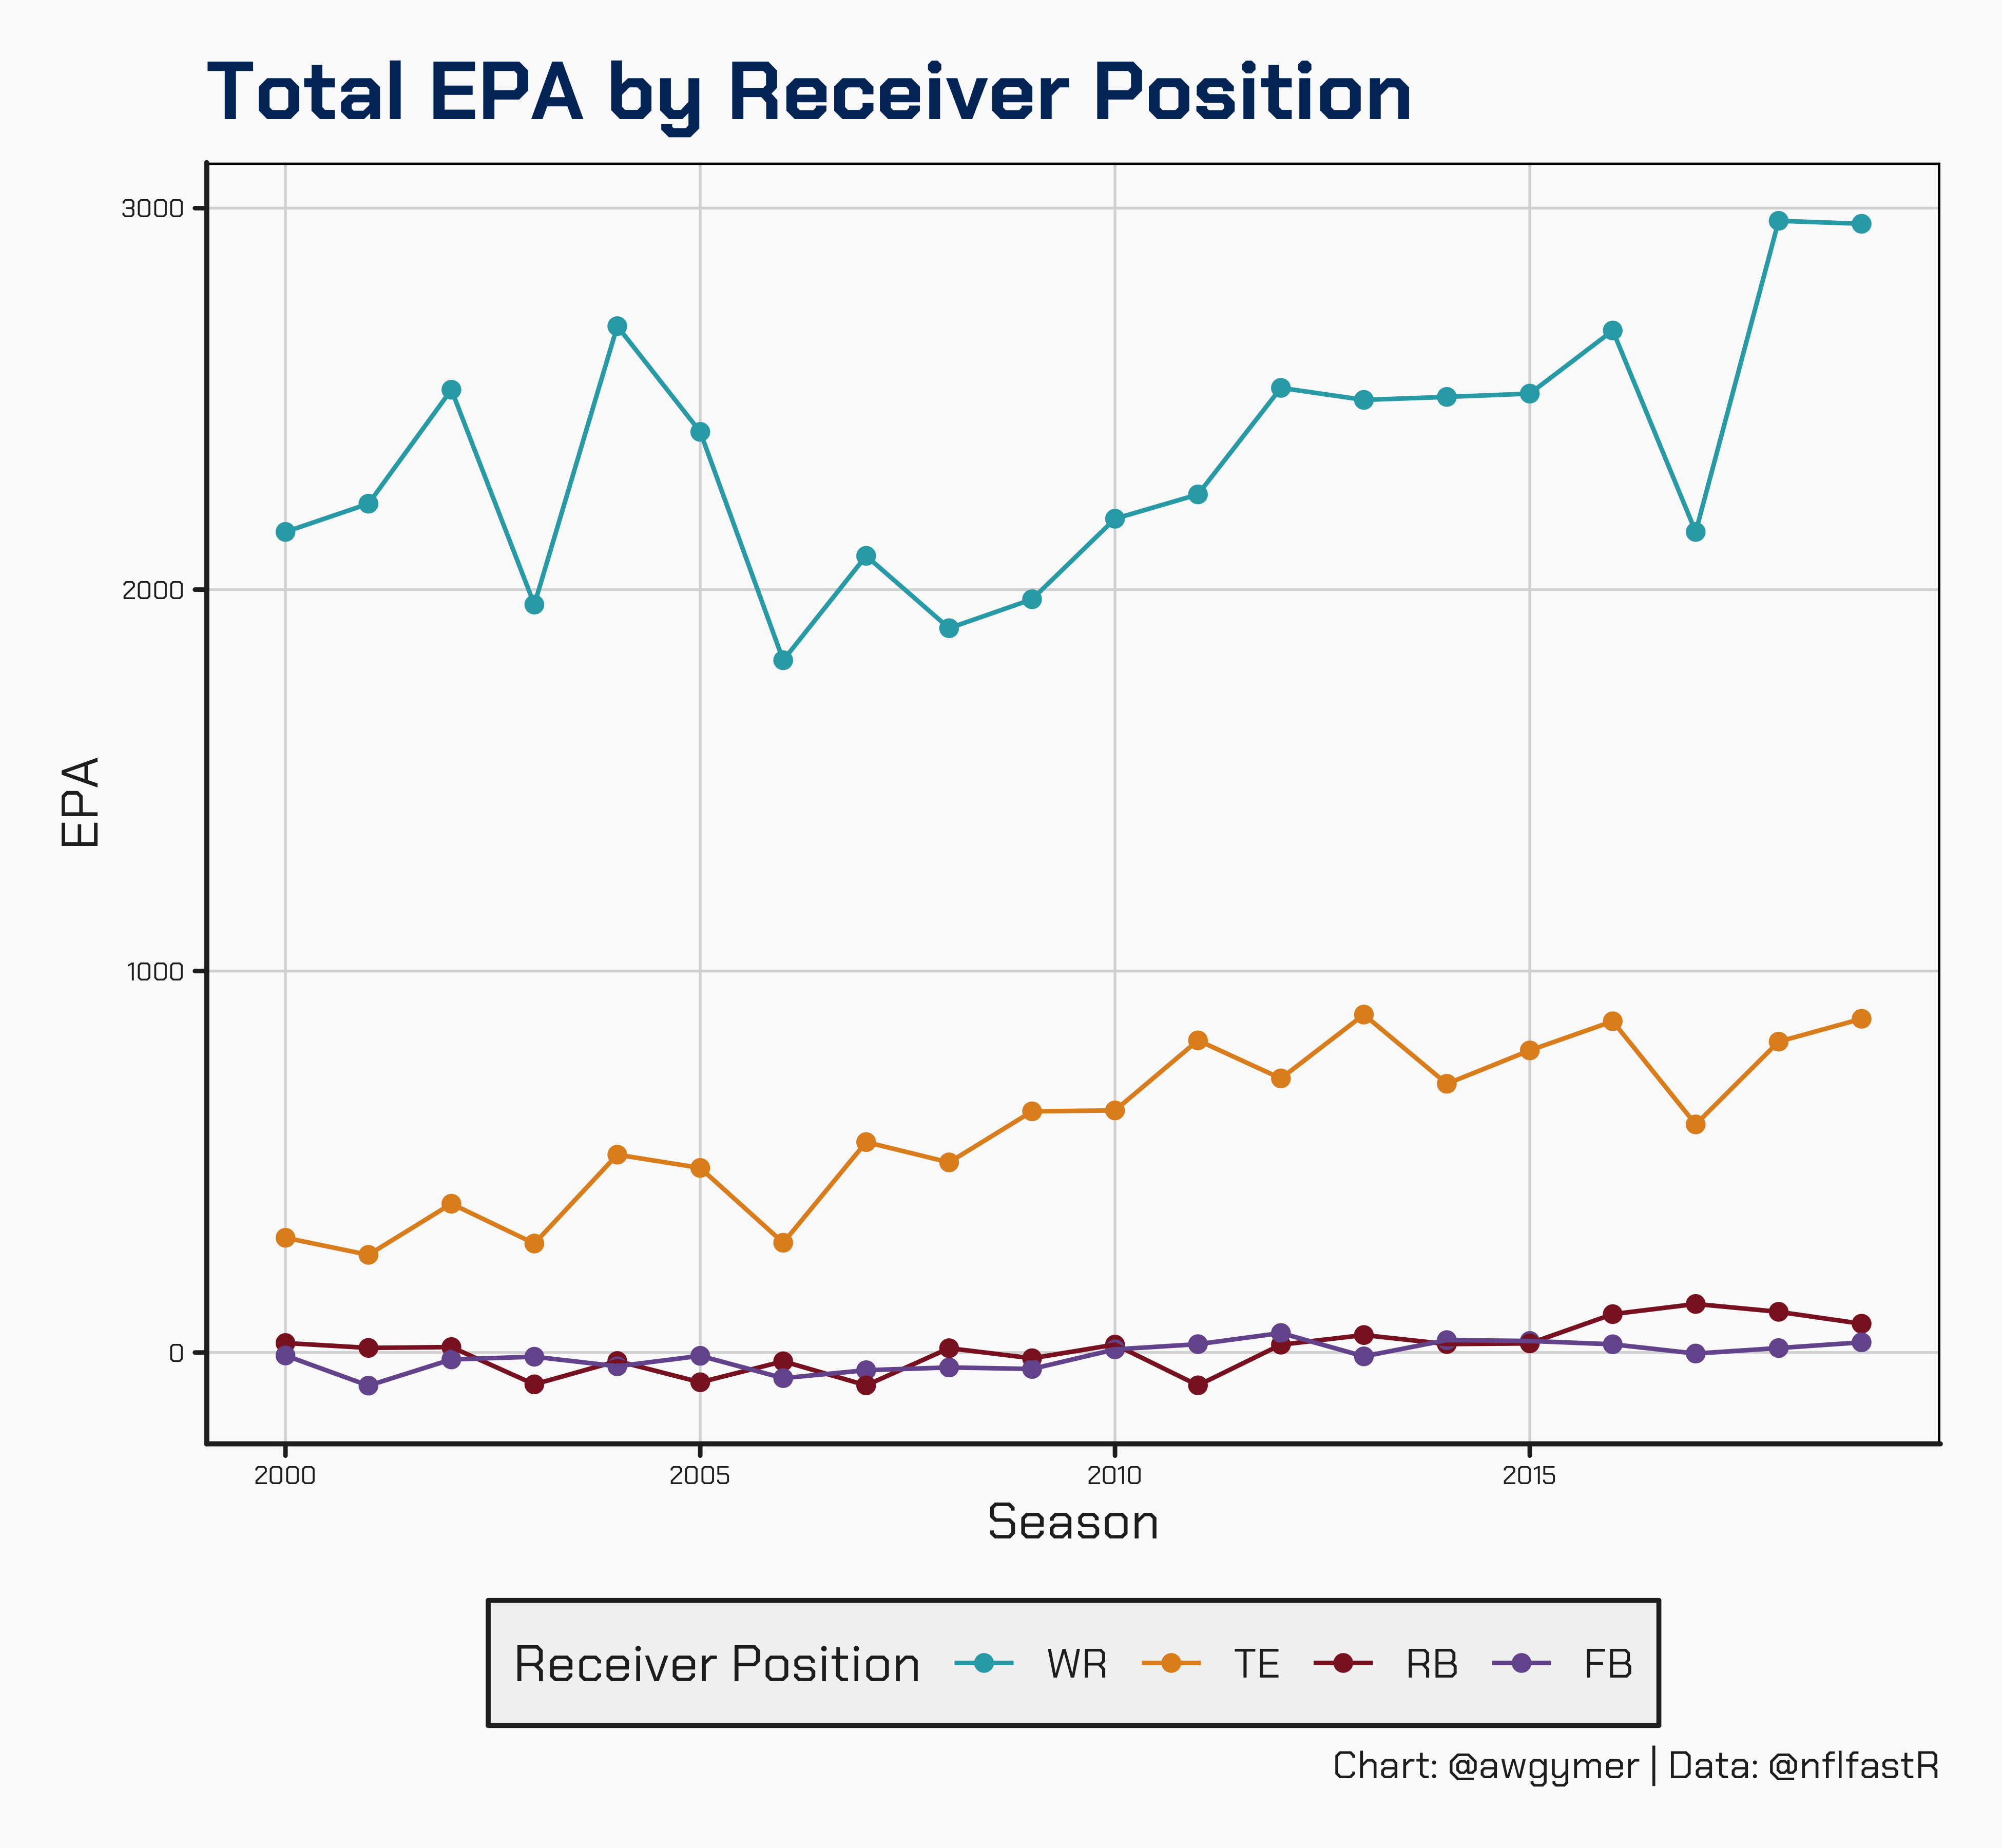
So tight-end targets and EPA are up, but are they just being used more or are they also seeing a change in how they are used?
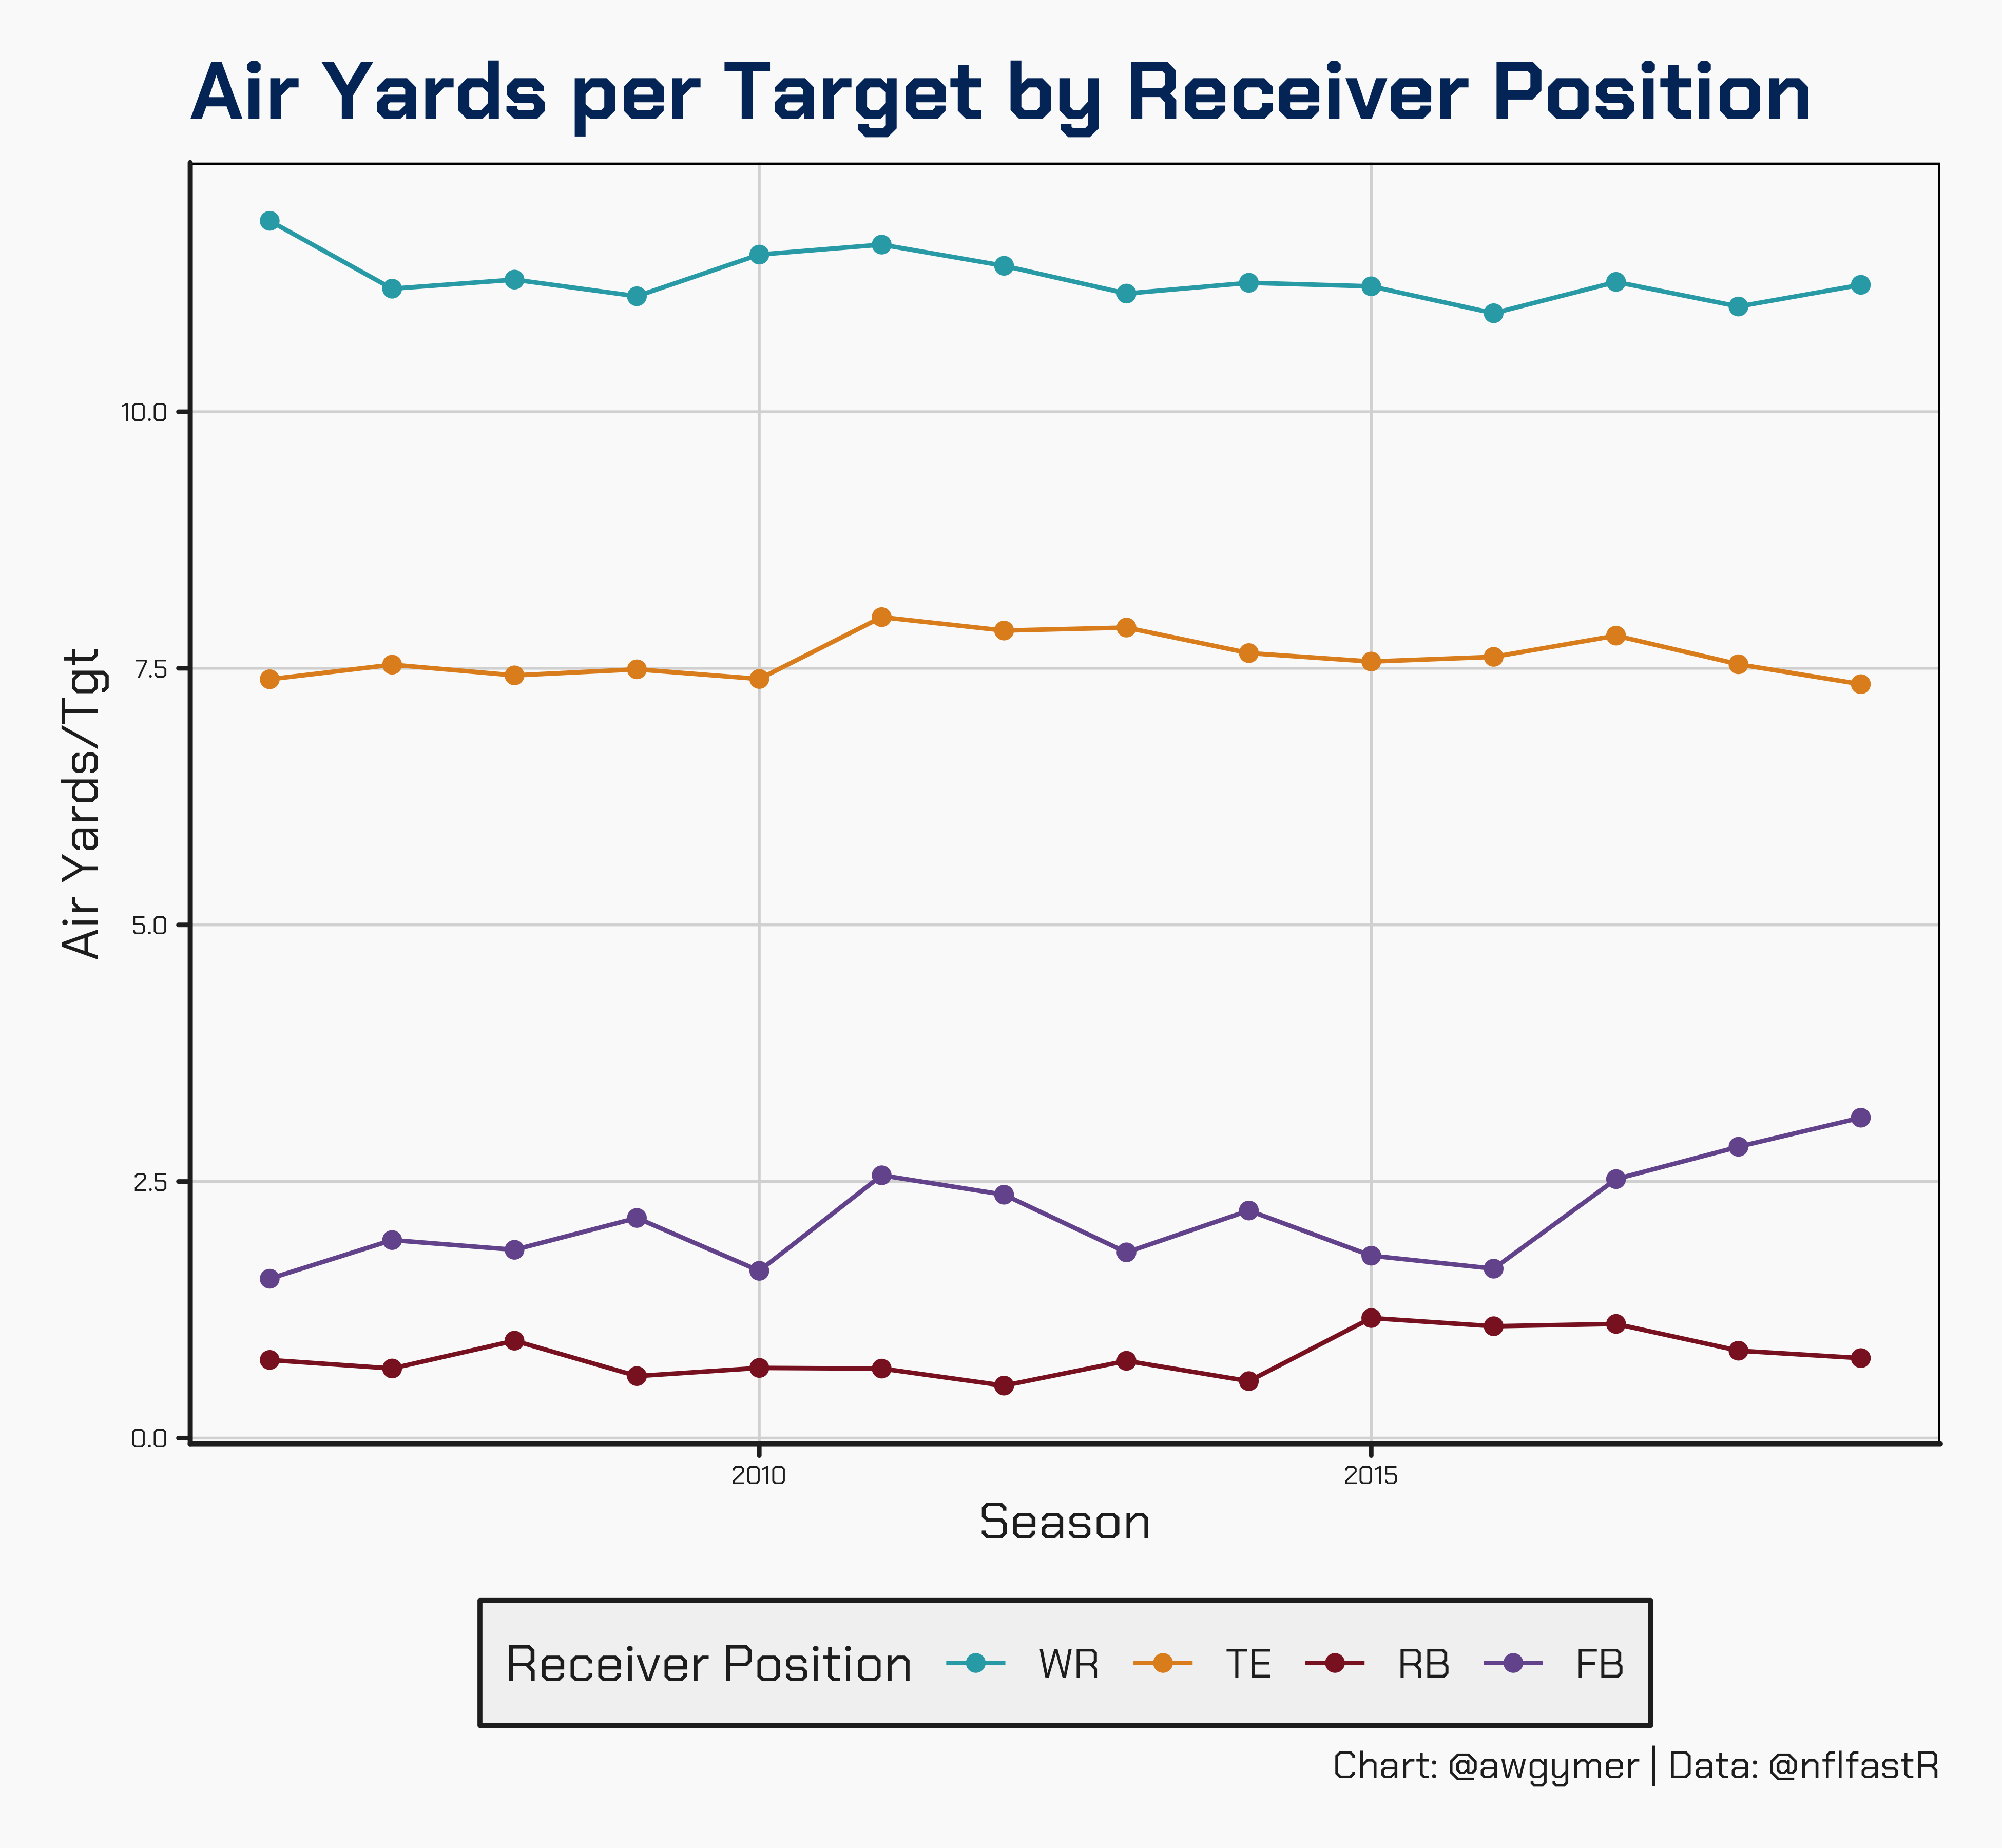
We only have air yards data as far back as 2006 and it doesn’t look like there has been much change in the average air yards on throws to TEs since then. Air Yards aren’t entirely indicative of differing usage - we don’t know where the TE is lining up - but it does suggest the position as a whole haven’t seen a move away from their traditional routes.
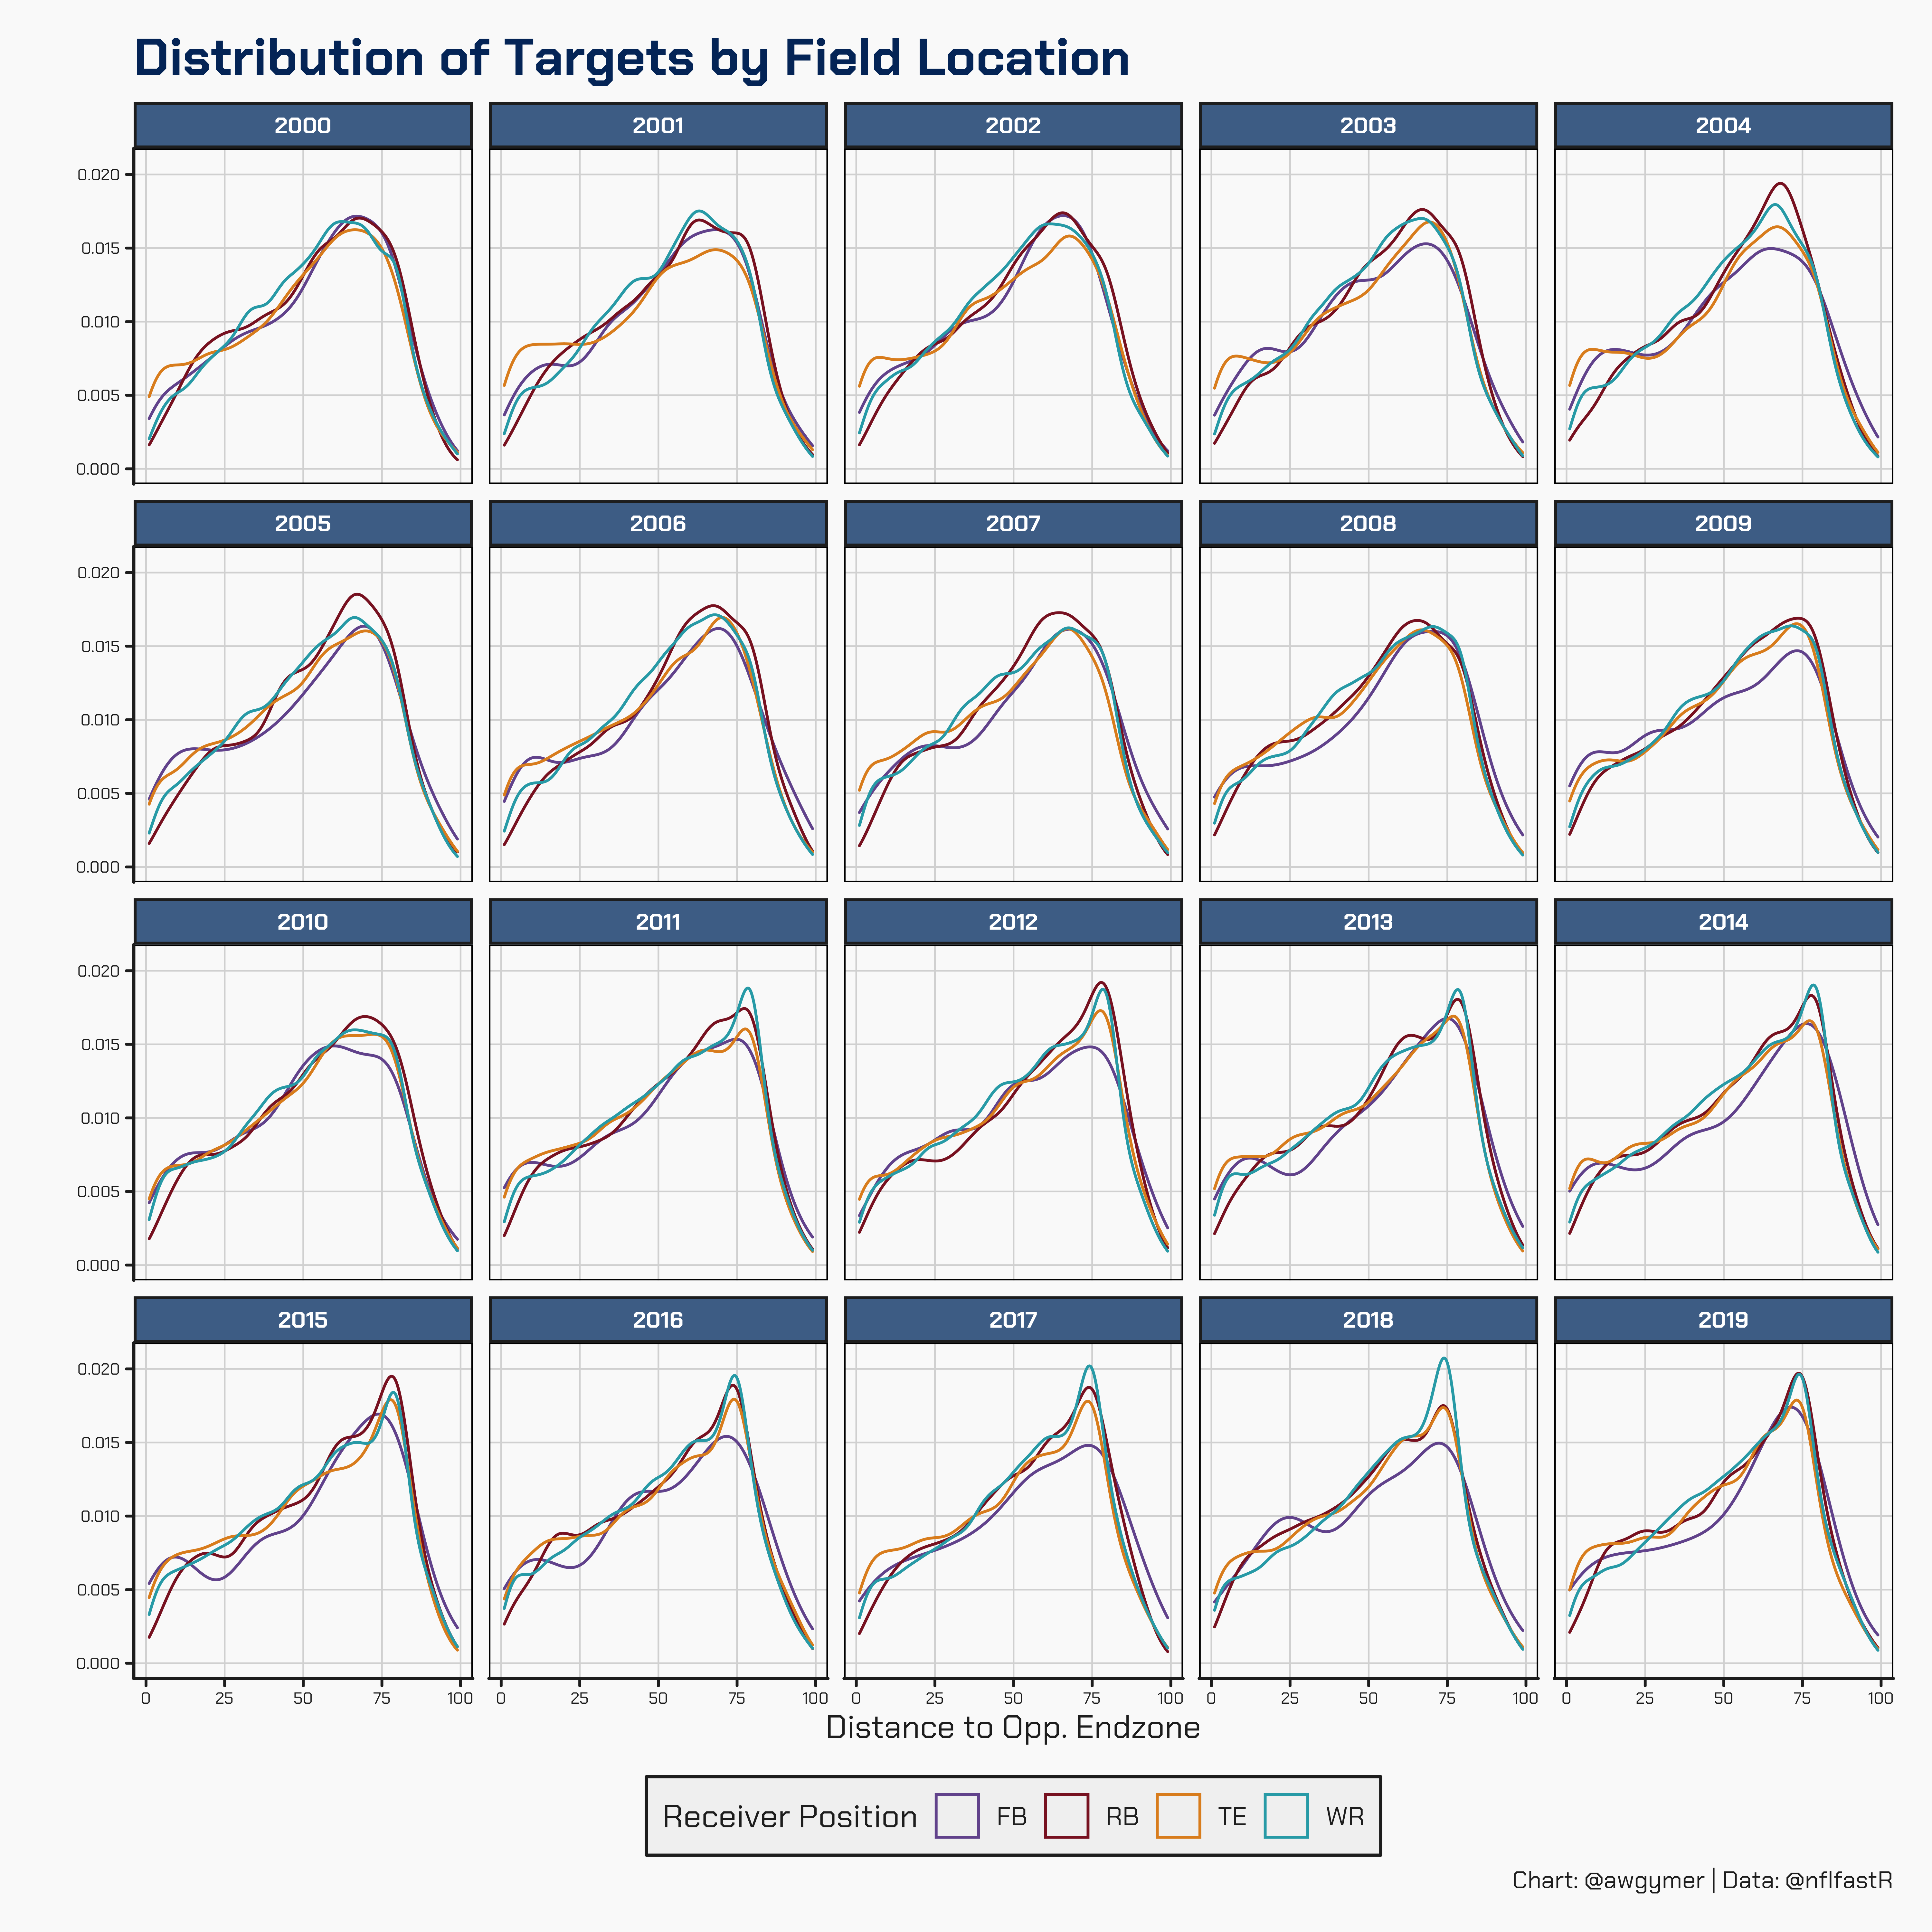
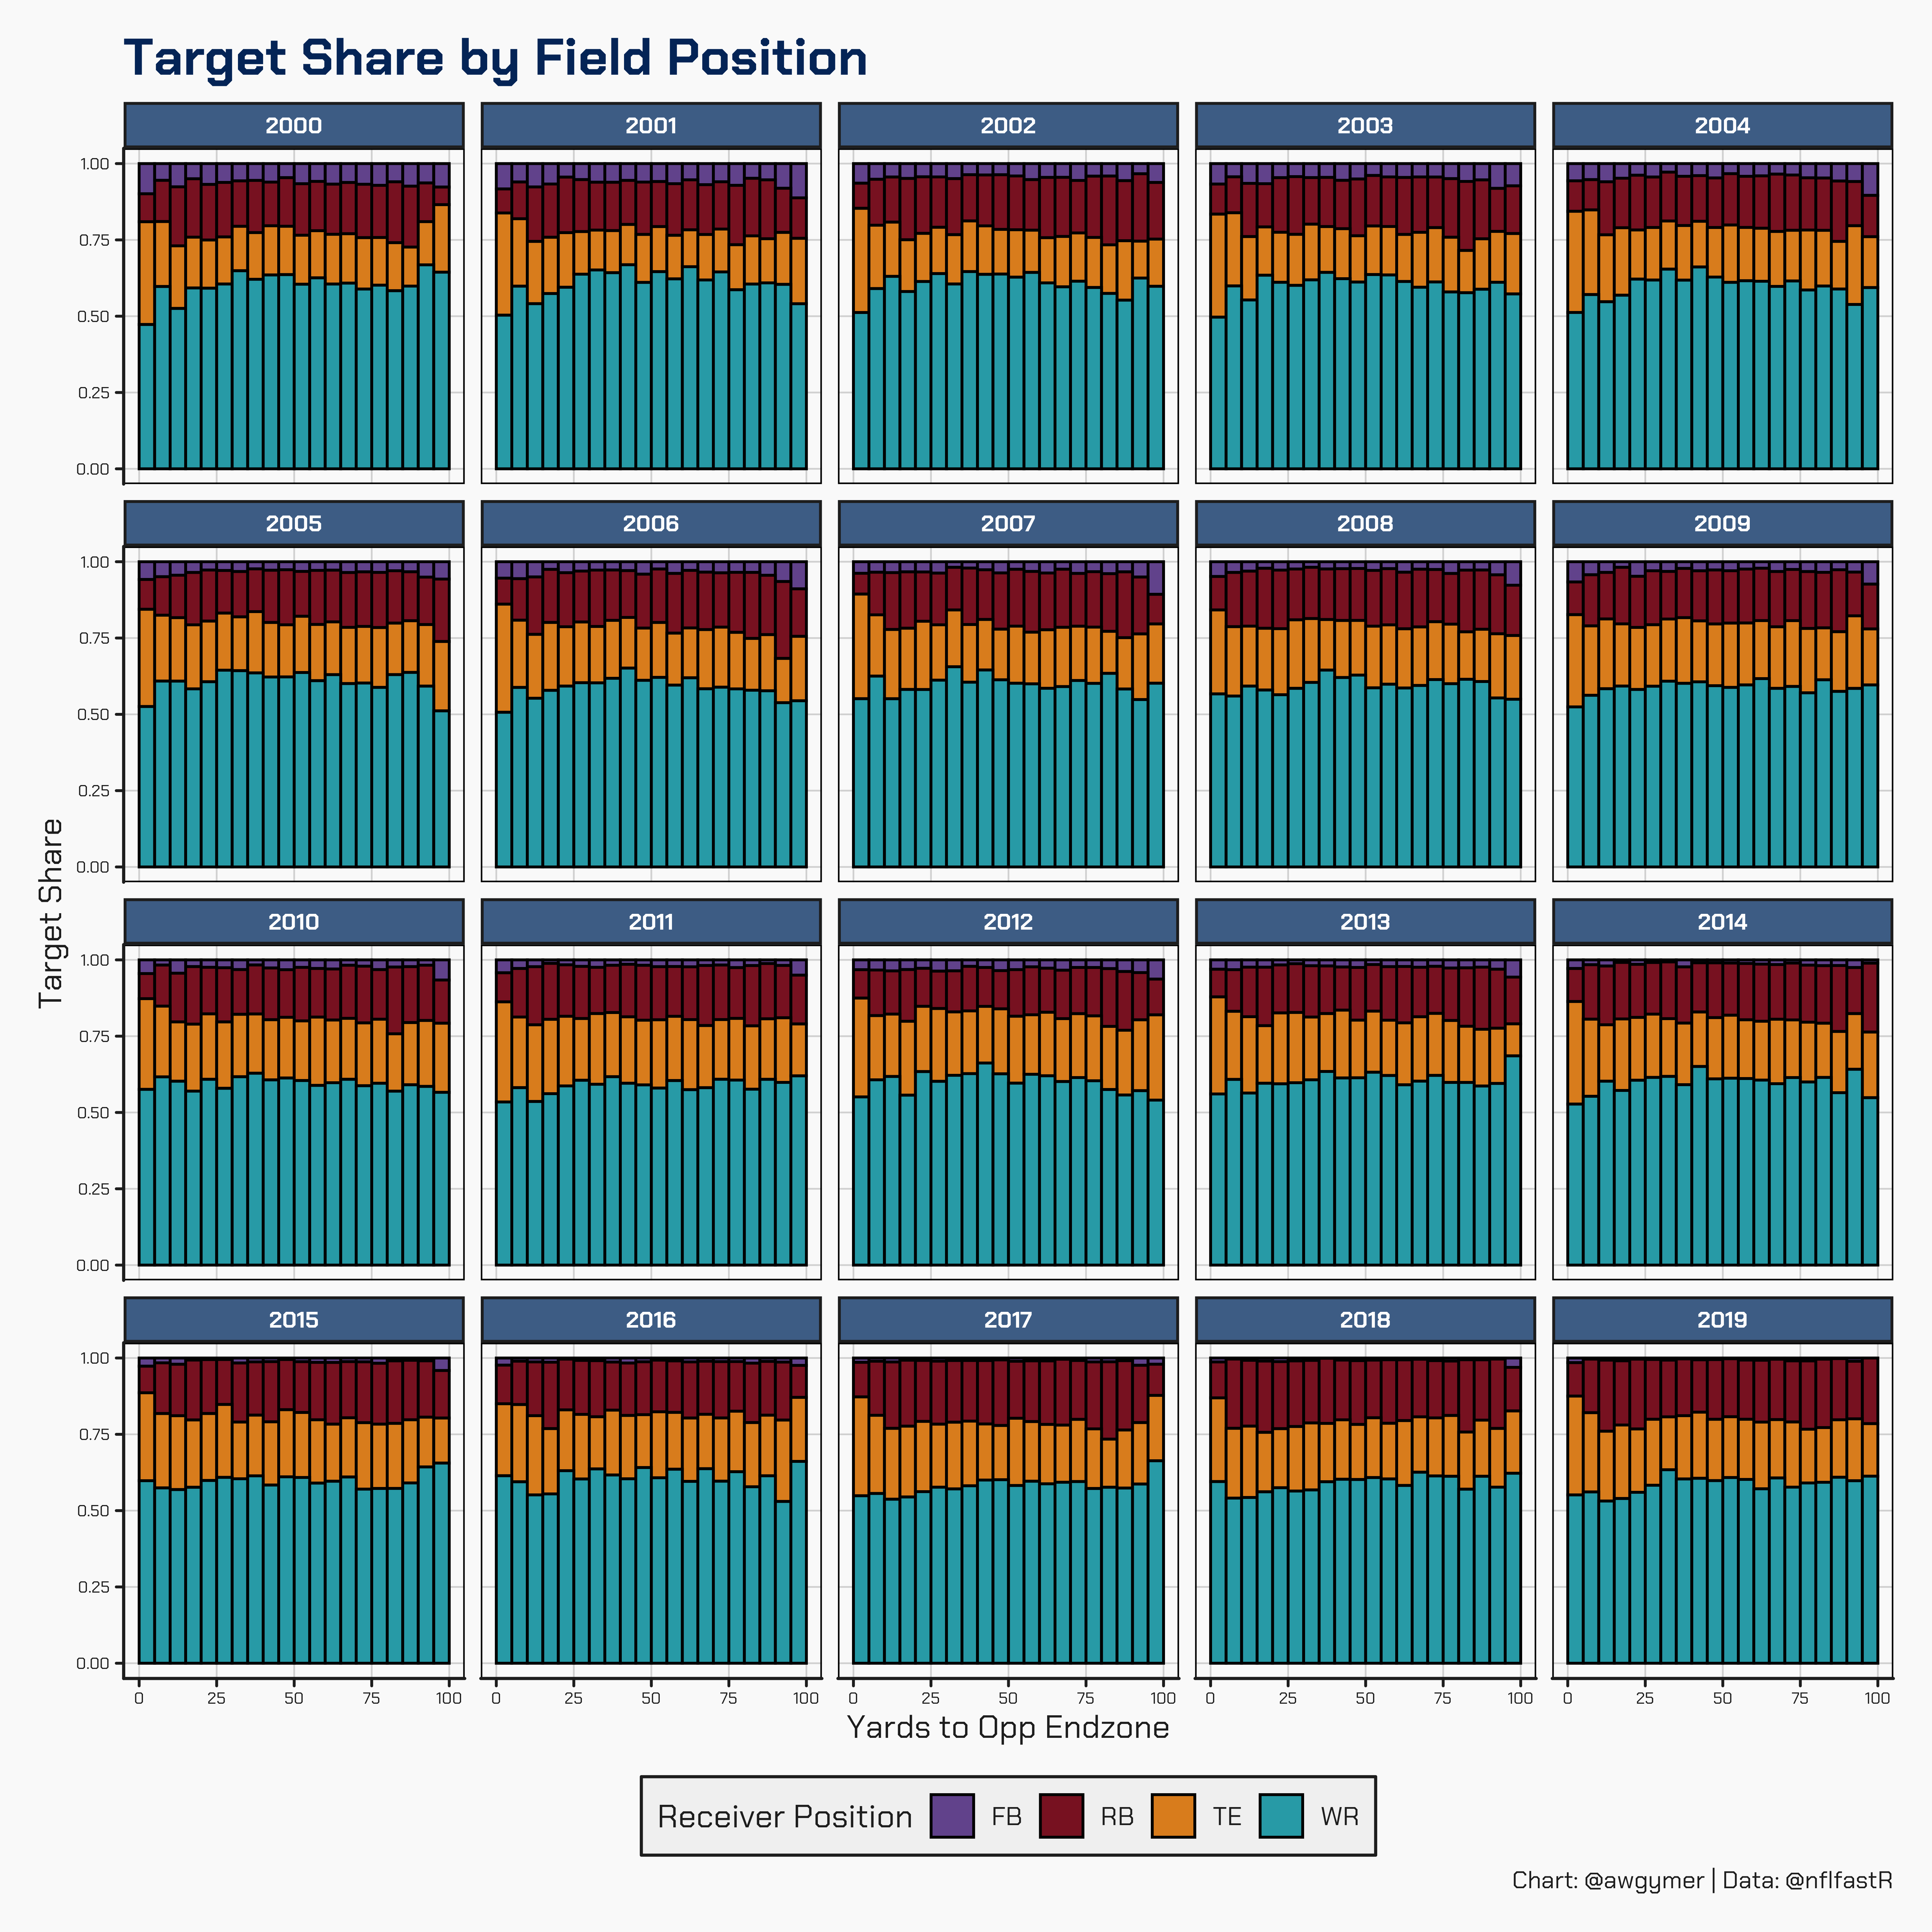
Plotting the smoothed distribution of targets by field position we see that all positions get the majority of their targets further from the goalline - this is pretty obvious when you consider where drives normally start and thus the fact that more passes are thrown there.
Ok so their target distribution looks similar to WRs but what about their share of targets at a given field position? Plotting the proportion of targets binned every 5 yards suggests that TEs get slightly higher share of targets right down by the goalline, largely eating into the RB share and historically some WR targets too, although that seems to have shifted in the past 5 years with WRs keeping their target share more at the goalline now.
Finally I want to look at the data on a per-team basis. Scheme is important and we might find some teams which use their TEs a bit more unusually.
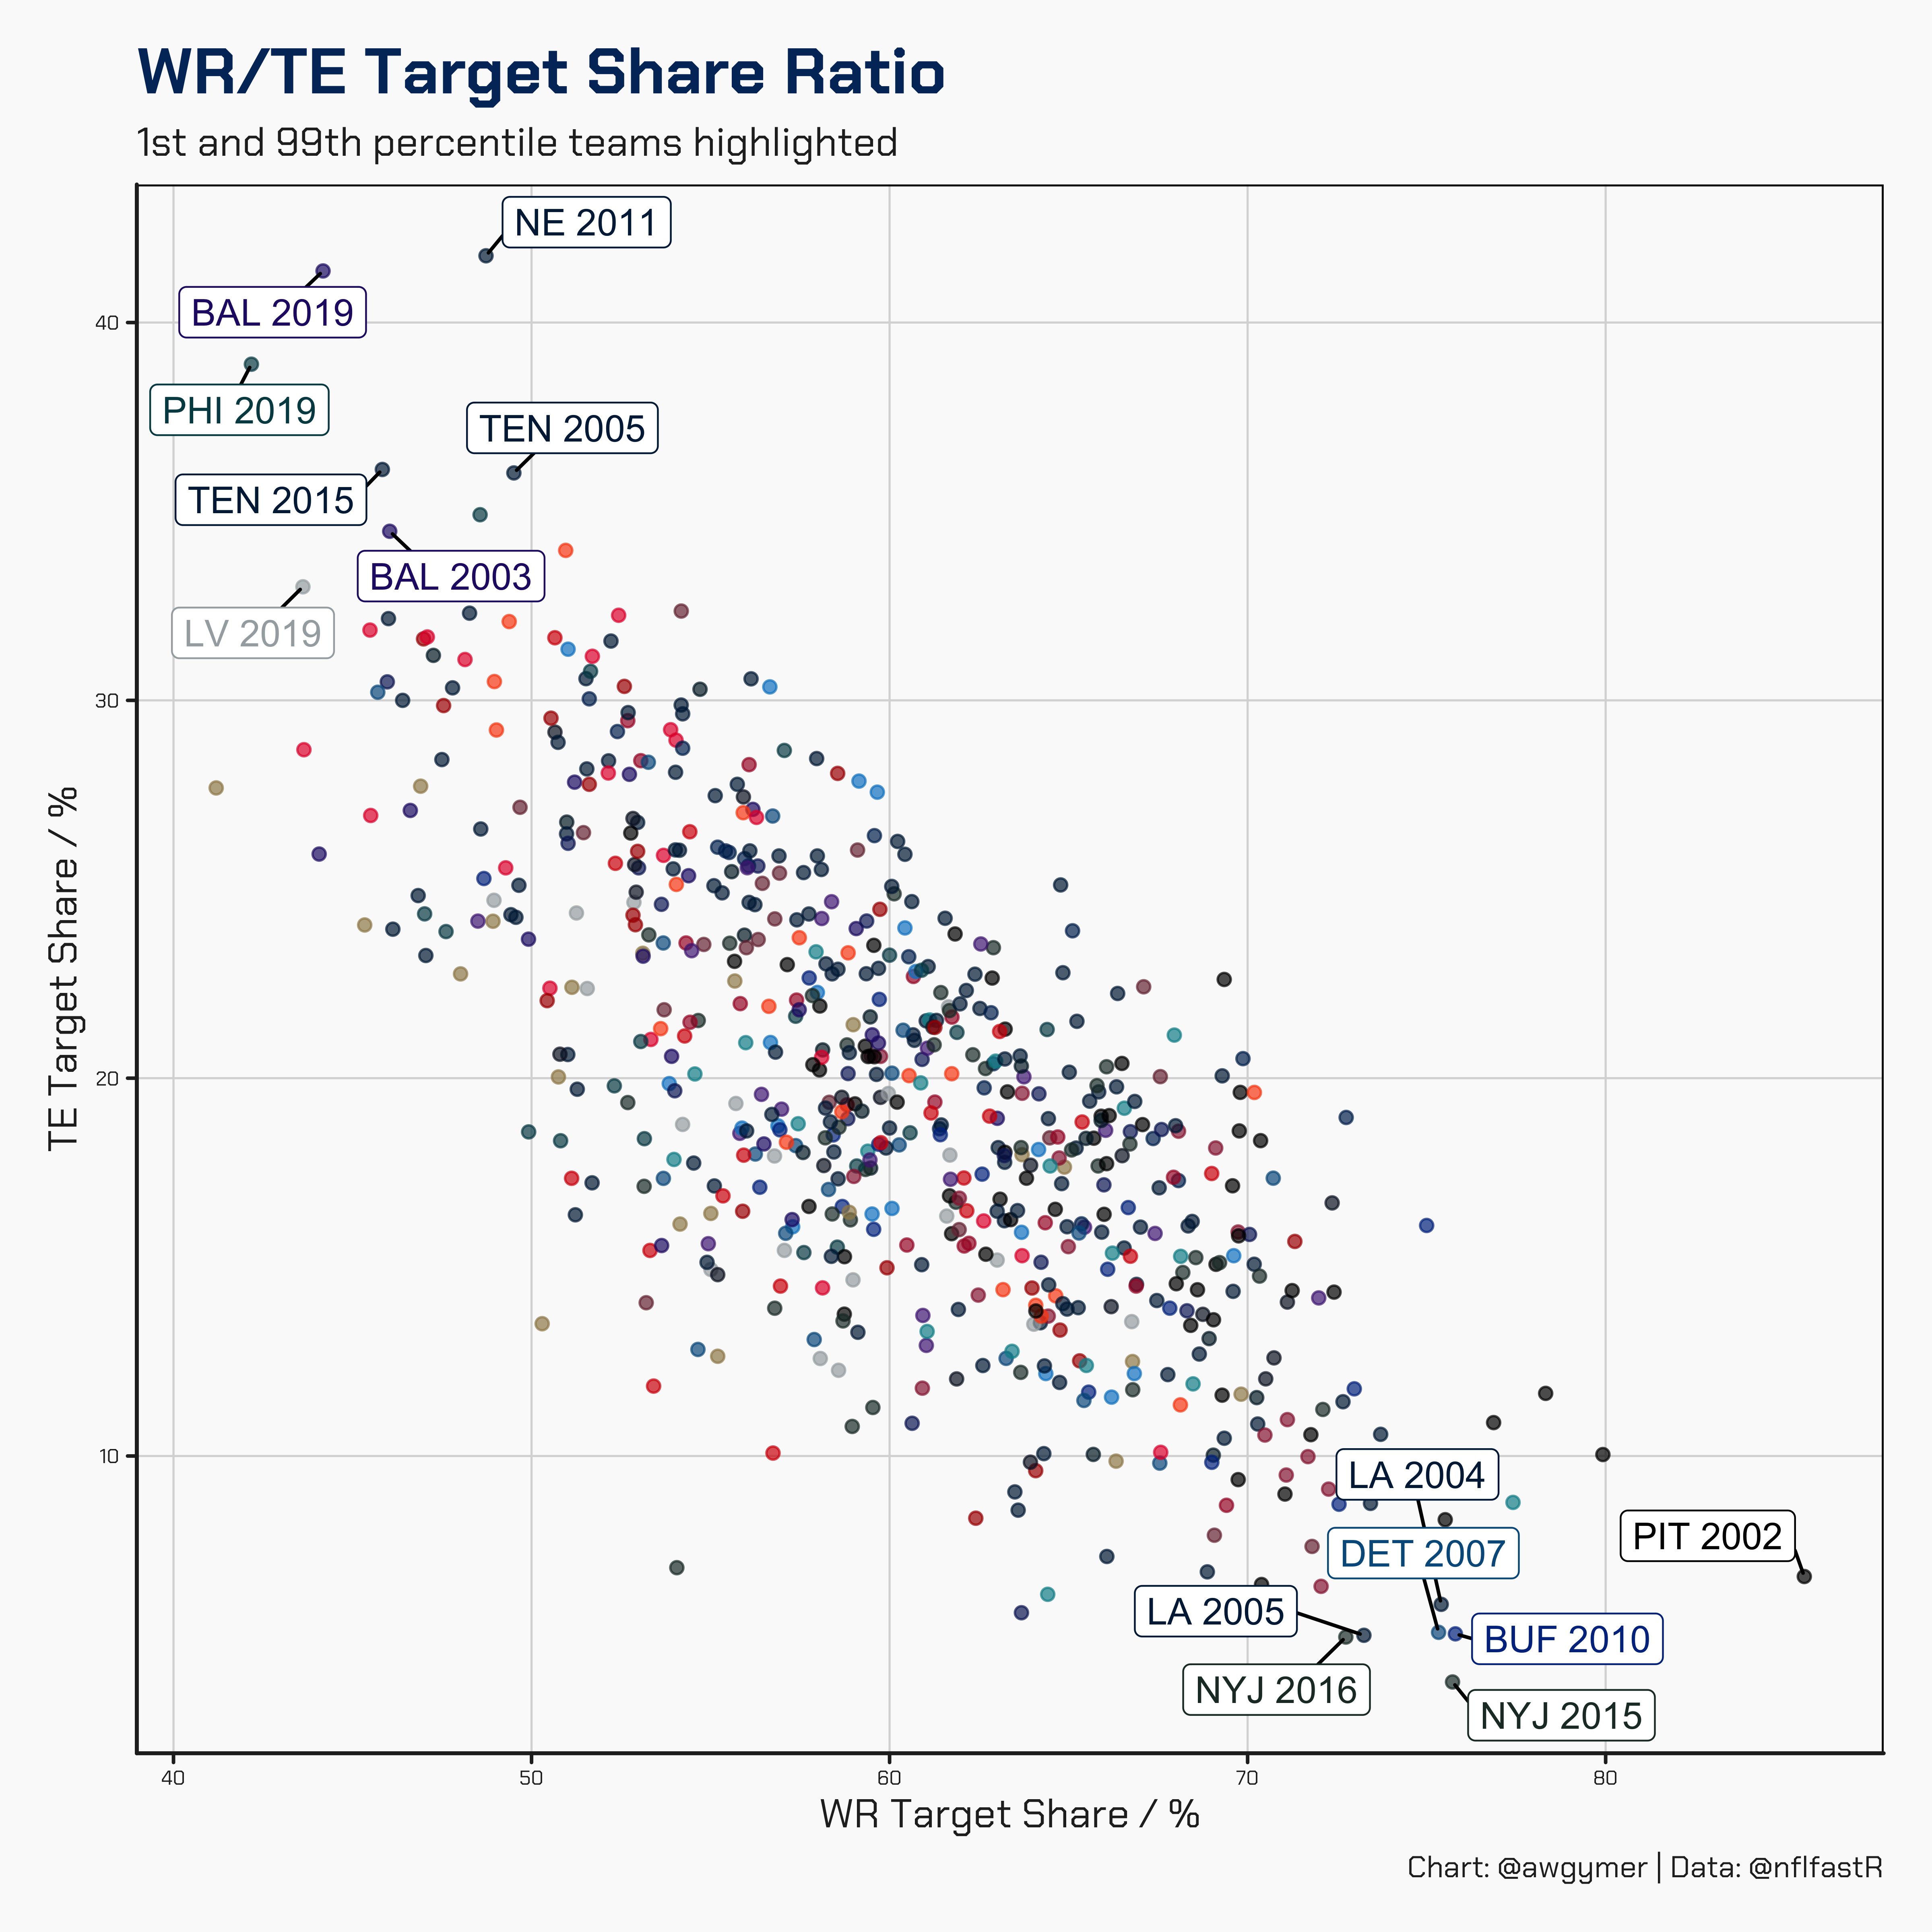
If we look at ratio of target-share for WR/TE there are a couple of teams which stand out, particularly those with high TE usage.
- 2003 Ravens: A lethargic passing offense lead by rookie Kyle Boller amasses just 2517 yds
- 2011 Patriots: Gronk and Hernandez at their peak
- 2019 Eagles: Wentz becomes first QB to throw over 4000 yds without a WR reaching 500 yds
- 2019 Ravens: Lamar Jackson marshals an unconventional offense with Mark Andrews as leading pass-catcher and 3 TEs in their top 5
- 2019 Raiders: Darren Waller has a breakout season after offseason Antonio Brown is signed and released without playing a game
At the other end we see the Ryan Fitzpatrick lead Jets of 2015-16 and a 2002 Steelers team featuring a WR corp of Hines Ward, Plaxico Burress, and Antwaan Randle El.
If you’re wondering about that little dark green dot that appears to have a very low TE and WR target share then let me introduce you to the 2000 New York Jets. A 37 year old Vinny Testaverde targeted FBs and RBs a combined 38.9% of the time; FB Richie Anderson notching up 88 receptions to put him 12th in the league and Curtis Martin catching 70 balls for 30th in the league.