Preface
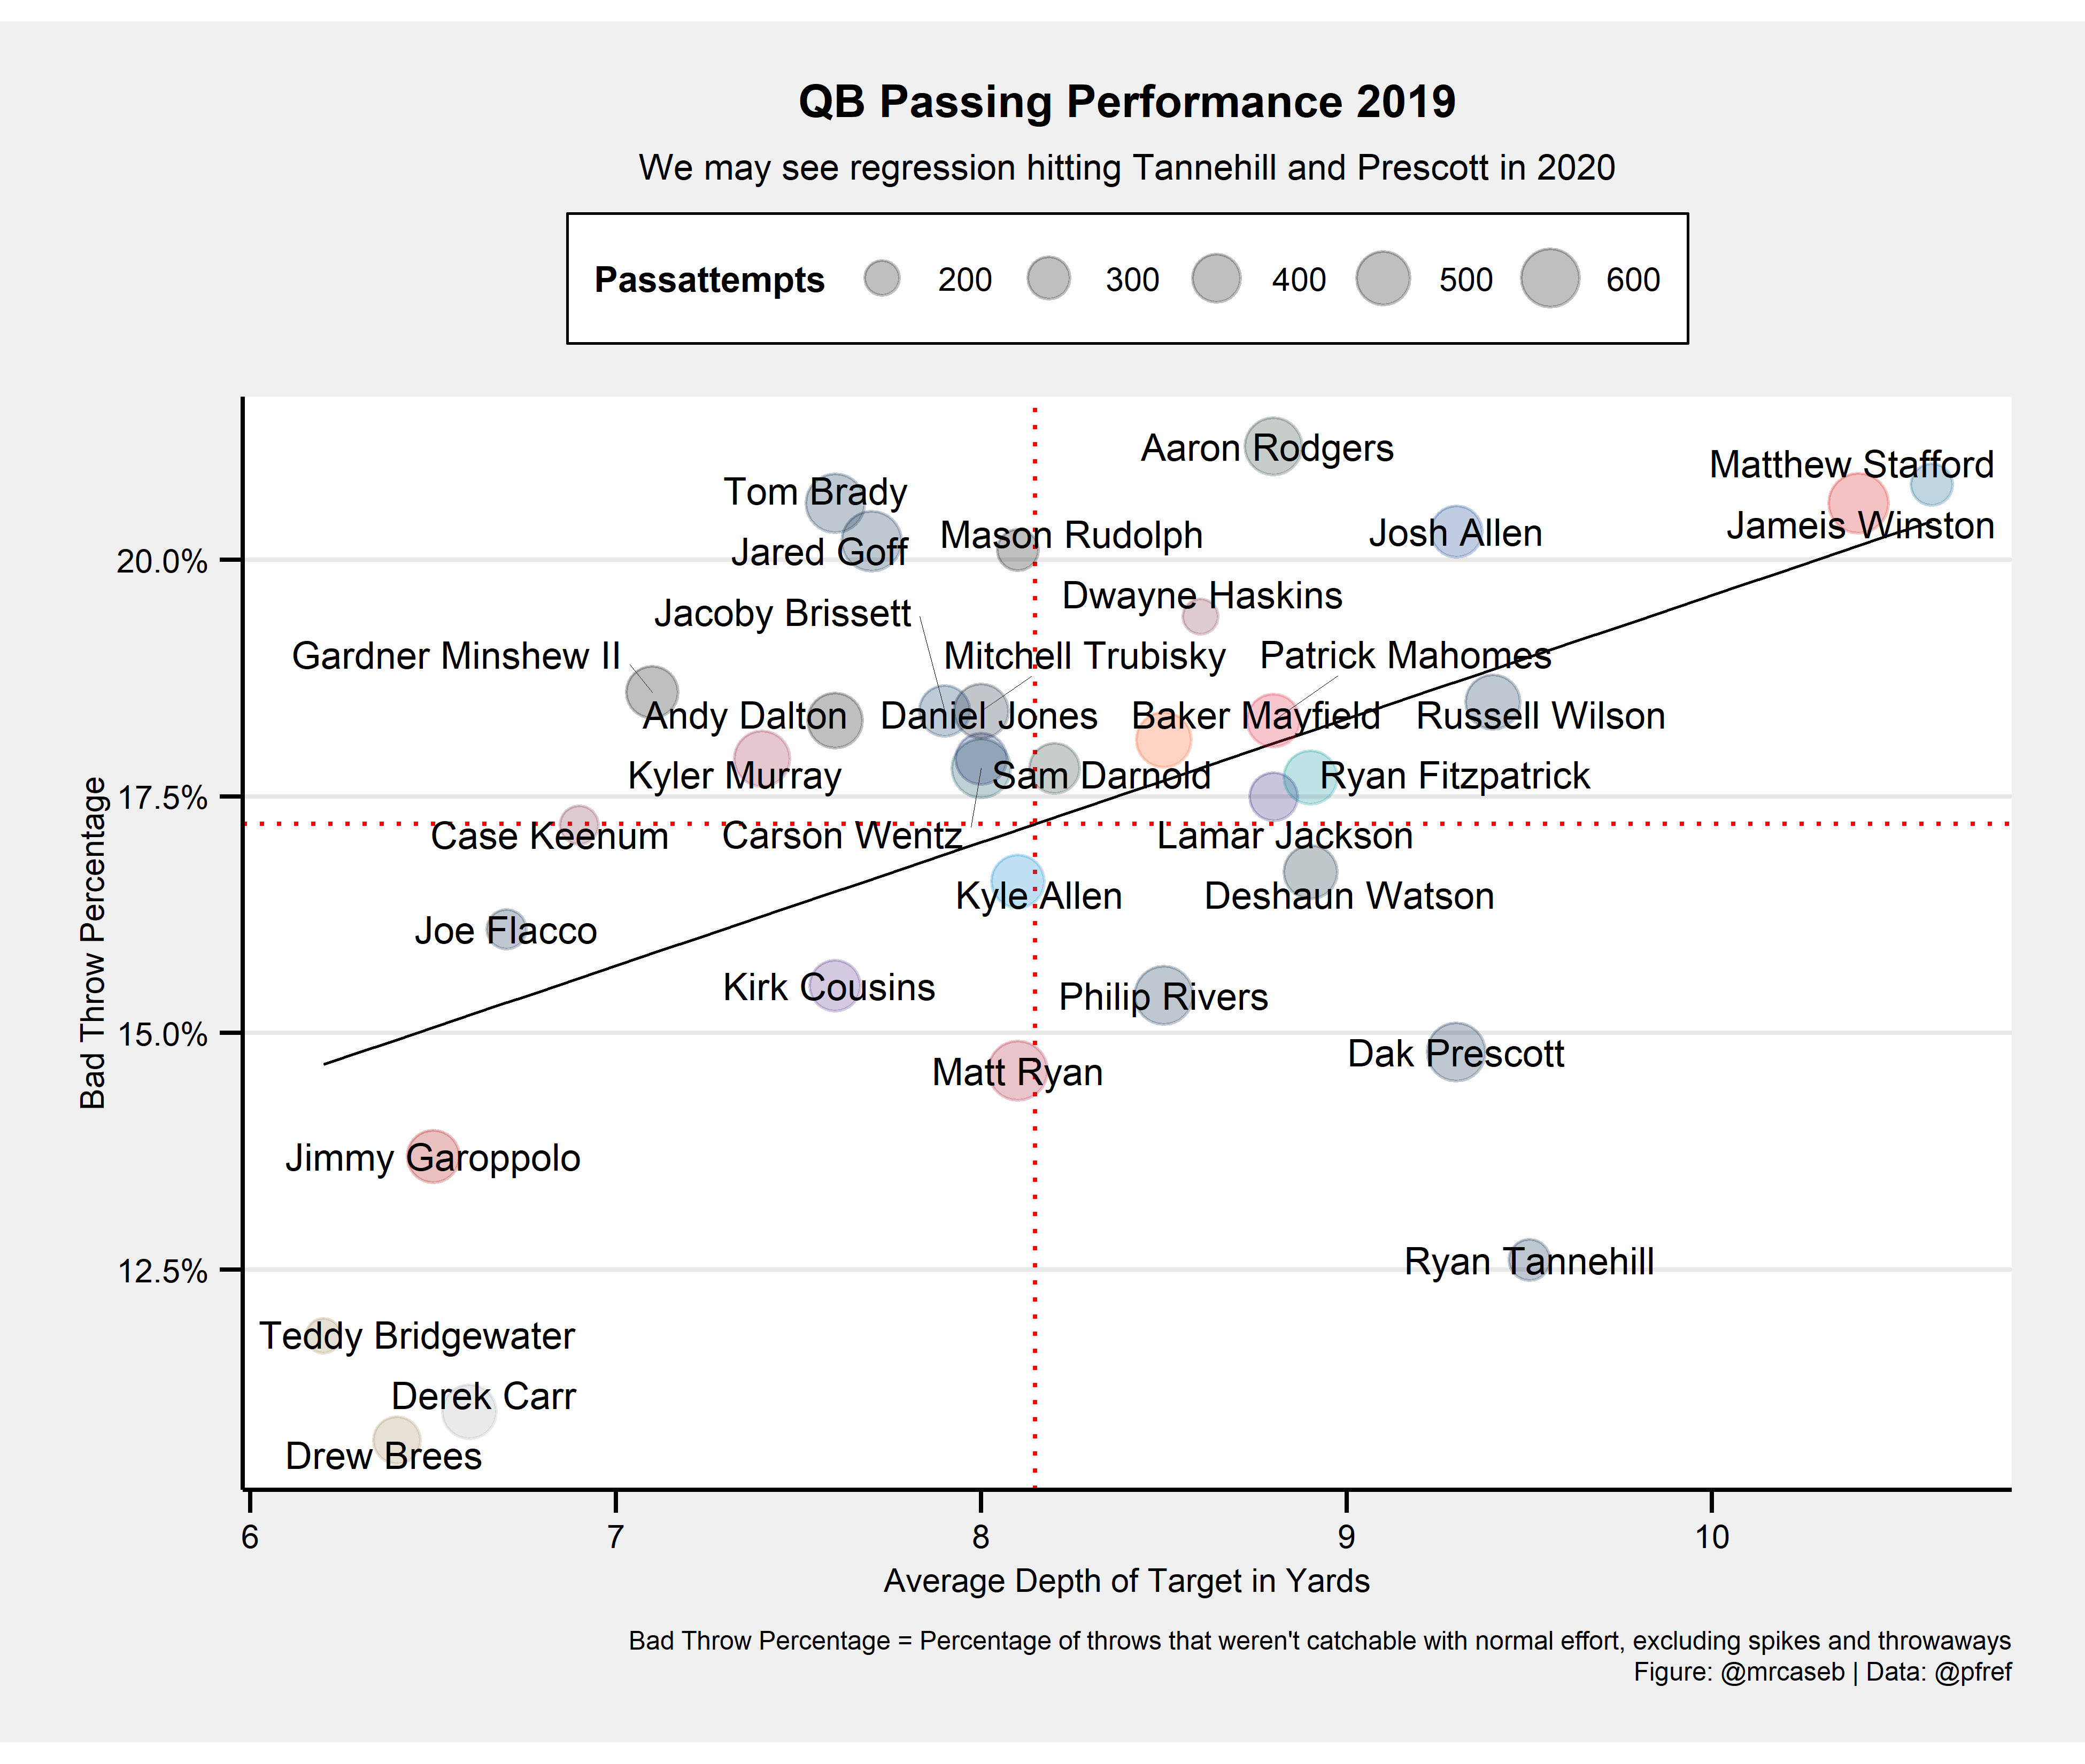
One of the most important sources for football related data is Pro Football Reference (short PFR). There are a ton of useful stats and I would like to look into their “Bad Throw Percentage” defined as
Percentage of poor throws per pass attempt, excluding spikes and throwaways
PFR provides it’s data on static html websites which makes it easy to scrape them. This will be demonstrated below.
Get the data and save it locally
Scraping data means traffic for the provider. We don’t want to annoy them so we scrape them once and save them locally. This can be done with the following code (please note it saves only the for this example relevant variables and you might want to change that):
library(tidyverse)
library(rvest)

# scrape data from PFR----------------------------------------------------------
url <- "https://www.pro-football-reference.com/years/2019/passing_advanced.htm"
pfr_raw <- url %>%
  read_html() %>%
  html_table() %>%
  as.data.frame()

# clean the scraped data--------------------------------------------------------

# rename the columns as the actual column names are saved in the first row now
colnames(pfr_raw) <- make.names(pfr_raw[1, ], unique = TRUE, allow_ = TRUE)

# drop the first row and select the columns we are interested in
pfr <- pfr_raw %>%
  slice(-1) %>%
  select(Player, Tm, IAY.PA, Bad., Att) %>%
  rename(team = Tm) %>%
  mutate(
    # pfr uses different team abbreviations than nflfastR, fix them
    team = case_when(
      team == "GNB" ~ "GB",
      team == "KAN" ~ "KC",
      team == "NOR" ~ "NO",
      team == "NWE" ~ "NE",
      team == "SFO" ~ "SF",
      team == "TAM" ~ "TB",
      TRUE ~ team
    ),
    # repair player names
    Player = str_replace(Player, "\\*", ""),
    Player = str_replace(Player, "\\+", ""),

    # make interesting columns numeric
    IAY.PA = as.numeric(IAY.PA),
    Bad. = as.numeric(str_replace(Bad., "%", "")),
    Passattempts = as.numeric(Att)
  ) %>%
  # join colors and logos from nflfastR
  left_join(nflfastR::teams_colors_logos, by = c("team" = "team_abbr"))

# save to disk------------------------------------------------------------------
# binary
saveRDS(pfr, file = "pfr_bad_throws.rds")

# ASCII
write_csv(pfr, "pfr_bad_throws.csv")
Create the plot
The data we want to have a look at is now saved locally and can be used to create the plot:
library(tidyverse)
chart_data <- readRDS("pfr_bad_throws.rds") %>% filter(Passattempts > 180)

chart_data %>%
  ggplot(aes(x = IAY.PA, y = Bad. / 100)) +
  geom_hline(aes(yintercept = mean(Bad. / 100)), color = "red", linetype = "dotted") +
  geom_vline(aes(xintercept = mean(IAY.PA)), color = "red", linetype = "dotted") +
  geom_smooth(method = "lm", se = FALSE, color = "black", size = 0.3) +
  geom_point(color = chart_data$team_color, aes(cex = Passattempts), alpha = 1 / 4) +
  ggrepel::geom_text_repel(aes(label = Player), force = 1, point.padding = 0, segment.size = 0.1, size = 3) +
  scale_y_continuous(labels = scales::percent) +
  scale_size_area(max_size = 6) +
  labs(
    x = "Average Depth of Target in Yards",
    y = "Bad Throw Percentage",
    caption = "Bad Throw Percentage = Percentage of throws that weren't catchable with normal effort, excluding spikes and throwaways\nFigure: @mrcaseb | Data: @pfref",
    title = "QB Passing Performance 2019",
    subtitle = "We may see regression hitting Tannehill and Prescott in 2020"
  ) +
  ggthemes::theme_stata(scheme = "sj", base_size = 8) +
  theme(
    plot.title = element_text(face = "bold"),
    plot.caption = element_text(hjust = 1),
    axis.text.y = element_text(angle = 0, vjust = 0.5),
    legend.title = element_text(size = 8, hjust = 0, vjust = 0.5, face = "bold"),
    legend.position = "top",
    aspect.ratio = 1 / 1.618
  ) +
  NULL